This article is contributed. See the original author and article here.
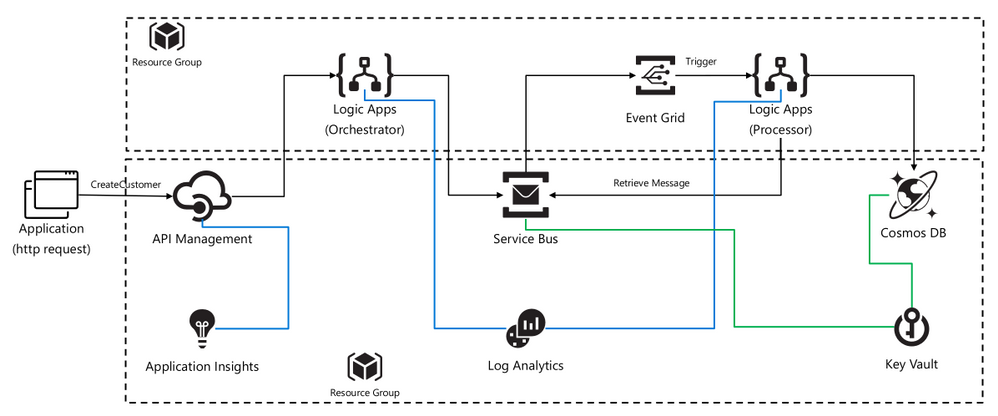
A fully automated DevOps deployment of an asynchronous pattern with Azure Integration Services. Setup with services like: API Management, Service Bus, Logic Apps, Event Grid, Key Vault (to store connections strings and keys for API Connections), Cosmos DB, Application Insights (for logging and monitoring API Management) and Log Analytics (for logging metrics from Logic Apps).
The architecture uses Logic Apps to orchestrate workflows and API Management to create catalogs of APIs. This version of the architecture adds two components that help make the system more reliable and scalable:
Azure Service Bus. Service Bus is a secure, reliable message broker.
Azure Event Grid. Event Grid is an event routing service. It uses a publish/subscribe (pub/sub) eventing model.
In this case I’ve used Cosmos DB to store the message, but this can be replace with any backend application.
In DevOps with the build pipeline all shared resources are deployed. The release pipeline deploys the specific services needed for this pattern. In this way are able to deploy, by cloning, multiple async pattern, using the same shared components for cost optimization.
Asynchronous communication using a message broker provides a number of advantages over making direct, synchronous calls to backend services:
Provides load-leveling to handle bursts in workloads, using the Queue-Based Load Leveling pattern.
Reliably tracks the progress of long-running workflows that involve multiple steps or multiple applications.
Helps to decouple applications.
Integrates with existing message-based systems.
Allows work to be queued when a backend system is not available.
Step by Step installation
Step 1: In the Azure Portal create a Service Principal
Choose a custom template and point to the zip-file in the devops folder. This repo will be imported into Azure DevOps and Pipelines are created for you.
The project is split-up into 2 pieces; shared resources & integration specific resources. Enabling you to extend your project with more integration and re-using the shared resources for cost efficiency.
Step 3: In Azure DevOps, create a service connection
Login with your account Azure DevOps. Go to the Project Settings of the DevOps Project you’ve created in step 2.
Go to Service Connections*.
Create a new service connection, choose Azure Resource Manager, next.
Select Service Principal (manual).
Fill in the Subscription Id, Subscription Name.
Copy the appId from step 1 in “Service Principal Id” and the password from step 1 in “Service Principal key”. Give the service connection a name and verify the connection.
Tick “Grant access permission to all pipelines. Save.
Step 4: In Azure DevOps, update the Variables Group.
Go to Pipelines, Library. Click on the Variable group “Shared Resources”.
Tick “Allow access to all pipelines.
Update the values of the variables to match your naming conventions needs. I’ve put in some generic naming, but you need to update the variables. Otherwise, the creation of some services will fail, because they’ve been already used.
The variable “KVCOSMOSDBLABEL” and “KVSERVICEBUSLABEL” are used as labels for Key Vault to retrieve the connection string and key for API Connections. Leave that as it is: “aissharedcosmosdb” and “aissharedservicebus”
Don’t forget to save.
Step 5: In Azure DevOps, update the Build pipeline and Run it.
In Tasks, select the Tasks which have the explaination mark “Some settings need attention”, and update Azure Subscription to your Service Principal Connection.
In Variables, update the variables to match your naming conventions needs. Keep in mind to pick unique naming for exposed services. I’ve put in some generic naming, but you need to update the variables. Otherwise, the creation of some services will fail, because they’ve been already used.
Save & queue.
Click the Agent Job to check the progress. Check if everything is create correctly, because of the unique naming for some services. And because it’s fun :)
Keep in mind that the CLI scripts will check if the resource is already created, before creating. I’ve used an ARM Template for the deployment of the Application Insights, because I wanted to automatically integrate it with the API Management Instance I’ve just created. This is not yet supported in AZ CLI.
Step 6: In Azure DevOps, add the Key Vault secret to the variables.
Go to Pipelines, Library. Add Variable group. Give it a name, something like “Key Vault Secrets”.
Tick “Allow access to all pipelines.
Tick “Link secrets from an Azure key vault as variables”.
Update the Azure Subscription to your Service Principal Connection.
Select the Key vault name. If your build pipeline ran succesfully, you can select your Key vault. Add variables, and it will popup with the secrets we’ve created earlier: “aissharedcosmosdb” and “aissharedservicebus”. Select it one by one, OK. And Save.
Step 7: In Azure DevOps, update the Release pipeline and Run it.
Go to Pipelines, Releases. Note. Because I’ve enabled continuous deployment in my template, there is a failed release there already. You can ignore that, because we are going to fix the release in the step.
In Tasks, select the Tasks which have the explanation mark “Some settings need attention”, and update Azure Subscription to your Service Principal Connection.
In Variables, update the variables to match the naming you used in the Build pipeline.
In Variables groups, link the “Key Vault Secrets” variable group, by clicking the Link button.
Save & Create Release.
Step 8: Go to your API Management Instance and test the API
In the Azure Portal, just go to API Management, APIs, click your new API (Customer), Click the operation POST and click the tab “Test”. Past the sample json (in this repo, sample-request.json) into the request body and click Send.
This article is contributed. See the original author and article here.
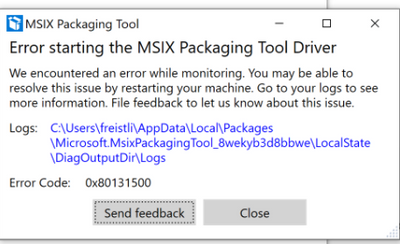
Recently I work on one MSIX packaging task to convert a traditional Win32 installer to .msix package with MSIX packaging tool, however always faced this kind of error message once start the packaging:
By checking the error log, it shows:
[8/14/2020 10:29:06 AM] [Error] Error monitoring: Insufficient system resources exist to complete the requested service
[8/14/2020 10:29:06 AM] [Debug] Getting environment object from %UserProfile%AppDataLocalPackagesMicrosoft.MsixPackagingTool_8wekyb3d8bbweLocalStateMsixGenerator.ConversionState.xml
[8/14/2020 10:29:06 AM] [Error] Error Occurred: Microsoft.ApplicationVirtualization.Packaging.Sequencing.SequencerException: Insufficient system resources exist to complete the requested service —>
Microsoft.ApplicationVirtualization.Packaging.MonitorException: Insufficient system resources exist to complete the requested service —>
System.ComponentModel.Win32Exception: Insufficient system resources exist to complete the requested service at Microsoft.ApplicationVirtualization.Packaging.Tracing.TraceController.Start(String logfilePath) at Microsoft.ApplicationVirtualization.Packaging.TracingSubsystem.<>c__DisplayClass6_0.<.ctor>b__0() at System.EventHandler`1.Invoke(Object sender, TEventArgs e)
However my PC has enough RAM (free 20GB), with latest Windows 10 update. I tried restarting PC and it doesn’t help as well. Don’t think it is a resource limit issue. With this question, I used Windows Feedback [Windows + F] to raised a feedback. The response from Window team was quick and quite helpful.
The error indeed failed when start new system event tracing sessions. These sessions can only be a limited amount of them system-wide, this limit is 64 by default, otherwise we will hit this ERROR_NO_SYSTEM_RESOURCES error.
2. Editing the REG_DWORD key at HKEY_LOCAL_MACHINESYSTEMCurrentControlSetControlWMIEtwMaxLoggers. Permissible values are 32 through 256
I didn’t take the steps as some system trace sessions can start when machine is starting up, and some traces should be stopped if they are not necessary. I used commands “logman query -etc”, “tracelog -l”, the result shows a lot of running trace sessions (up to 50). Although they are not hit 64 limits, I thought reducing them will be definitely worth trying.
After some quick research, I can see the Perfmon Monitor will be helpful to manage the running system trace session easily. After taking below steps, the MSIX error is resolved immediately:
1. In Start command, type “Performance Monitor”, start it as Admin
2. Choose Data Collector Sets -> Event Trace Sessions, right click to stop some sessions
3. To avoid this issue from next rebooting, can disable some of them in Data Collector Sets -> Startup Event Trace Sessions
This article is contributed. See the original author and article here.
What is the issue?
The customer asked SI (system integration) partner to migrate their system to cloud in the form of “lift-and-shift”, but session affinity did not work properly.
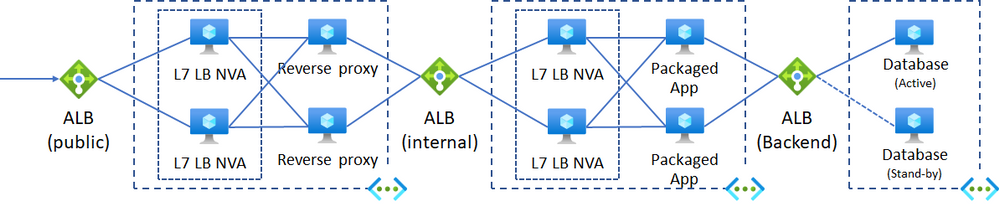
Environment and deployment topology
Their deployment topology is listed below. This issue occurred after migration completed. The customer does not configure their system on multi-region for availability.
Azure Load Balancer (ALB) : Traffic routing is based on protocol and client IP.
We’d like to configure cookie based session affinity.
We’d like to achieve it as inexpensive as possible.
Situation
In case packaged application is hosted on Java EE application server, session affinity is typically configured using clustering of Java EE application server or session sharing with in-memory data grid or cache. However, they cannot configure application server cluster since clustering is restricted against the edition they use. And the SI partner deployed L7 LB NVA behind ALB to achieve session affinity, as the SI partner knew ALB did not have session affinity feature.
Let’s imaging causes of this issue
There are many people who can imagine the root cause when looking at the deployment topology above. The following points should be checked.
Would source IP of inbound traffic to ALB (public) change? Specifically, would global IP be changed when transforming local IP to global IP using SNAT on customer site?
ALB does not have any feature for session affinity. Therefore, if source IP of inbound traffic is changed, the destination VM which hosts packaged application should change.
Would reverse proxy develop side effect?
Would L7 LB NVA which deploys behind ALB work as expected? Would session information be shared between both NVAs?
Root cause
This issue occurred due to the following configuration.
Source IP of inbound traffic was sometimes changed.
When source IP was changed, ALB (public) recognized that this traffic came from another client and routed the traffic to another L7 LB NVA.
L7 LB NVAs were deployed behind ALB for session affinity, but they did not work expectedly since session information was not shared with the NVAs. When inbound traffic was routed to one L7 LB NVA, the L7 LB NVA did not have any way to identify session continuity. So, the NVA recognized that this traffic came from other client.
The following URL describes traffic distribution rule.
The following table is listed what happened in each component specifically.
Component
What would happens?
ALB (Public)
The fact of the matter is that traffic comes from the same client, but the traffic is sometimes NATed into other global IP. In this case, ALB (public) recognizes that this traffic comes from different client, and routes the traffic to any L7 LB NVAs. Therefore, chosen L7 LB NVA might be different from the one processed previous traffic from the same client.
L7 LB NVA
If L7 LB NVAs are configured in the form of “Active-Active” but session information is not shared between L7 LB NVAs, no L7 LB NVA can identify whether or not the traffic comes from the same client. Therefore, L7 LB NVA can route traffic to any reverse proxy NVAs and chosen reverse proxy NVA might be different from the one processed previous traffic.
ALB (Internal)
If a reverse proxy NVA where current traffic passed is different from the one processed previous traffic, ALB (Internal) recognizes that this traffic comes from different client since source IP is different, and routes the traffic to any internal L7 LB NVAs. Therefore, chosen L7 LB NVA might be different from the one processed previous traffic from the same client.
Internal L7 LB NVA
This is the same as mentioned above. Since session information is not shared between internal L7 LB NVAs, no internal L7 LB NVA can identify whether or not the traffic comes from the same client. Therefore, internal L7 LB NVA can route traffic to any VMs hosted packaged application and chosen VM might be different from the one processed previous traffic.
Packaged Application
Traffic routing was not consistent due to reasons mentioned above, so traffic was sometimes routed to the VM which handled previous traffic, and at other times another traffic was routed to the different VM.
Solution
I commented points to be fixed and SI partner reconfigured component topology. After that, traffic was routed to an expected package application node.
ALB, L7 LB NVAs, and Reverse Proxy NVAs were replaced with Azure Application Gateway (App GW).
Cookie based affinity was enabled following the document.
Here is the reconfigured component topology. This topology helped the customer reduce NVA related cost and operational cost.
Others
I did not recommend using Azure Front Door as a public L7 LB since the customer’s system was not multi-region supported and global service was useless.
In this case, requirements for reverse proxy could cover App GW’s features. If App GW does not meet customer requirements for reverse proxy (for example, reverse proxy for authentication gateway is required), the following topology would be better.
Conclusion
The following points are important when migrating existing systems to cloud.
Good understanding of services you are using.
Simple deployment topology. In other words, decrease the number of components you use.
This article is contributed. See the original author and article here.
A few months ago, I had a chance to do live streaming with Cheese (@seojeeee) about this topic – Part 1 and Part 2 in Korean. I know it’s warm and humid in the summer season in Korea. Therefore, I implemented this feature for my air-conditioning system at home, as well as other home appliances that work with remote controllers. However, as I have very little knowledge of Raspberry PI and other hardware, it was really challenging. This is the post to note to future self and others who might be interested in this topic.
Part 1: Turning Raspberry PI into Remote Controller
Part 2: Turning on/off Home Appliances Using Raspberry PI, Serverless and Power Platform
The sample codes used in this post can be found at this GitHub repository.
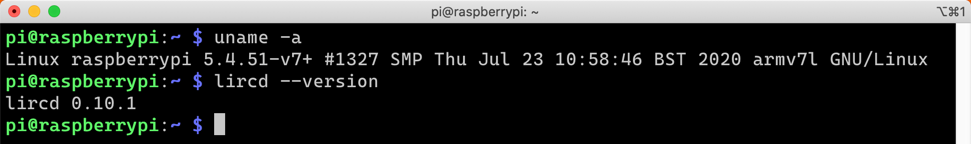
Check Hardware and Software Specs
It might be only me, but I found that Raspberry PI and its extension modules like IR sensor are very version sensitive. I Google’d many relevant articles on the Internet, but they are mostly outdated – not valid information any longer. Of course, this post will also have a high chance to be obsolete. Therefore, to avoid visitors from being disappointed in the future, it would be a great idea that I specify which hardware and software spec I used.
Your Raspberry PI OS has now been up-to-date and got the LIRC module installed.
LIRC Module Configuration
Let’s configure the LIRC module to send and receive the IR signal.
Bootloader Configuration
By updating the bootloader file, when Raspberry PI starts the LIRC module starts at the same time. Open the bootloader file:
sudo nano /boot/config.txt
Uncomment the following lines and correct the pin number. The default values before being uncommented were 17 for gpio-ir and 18 for gpio-ir-tx. But it should be swapped (line #5-6).
Of course, it might be working without swapping the pin numbers. But it wasn’t my case at all. I had to change them to each other.
# Uncomment this to enable infrared communication.
#dtoverlay=gpio-ir,gpio_pin=17
#dtoverlay=gpio-ir-tx,gpio_pin=18

dtoverlay=gpio-ir,gpio_pin=18
dtoverlay=gpio-ir-tx,gpio_pin=17
LIRC Module Hardware Configuration
Let’s configure the LIRC module hardware. Open the file below:
Once you’ve completed by now, reboot Raspberry PI to recognise the updated bootloader.
sudo reboot
Send this command to check the LIRC module working or not.
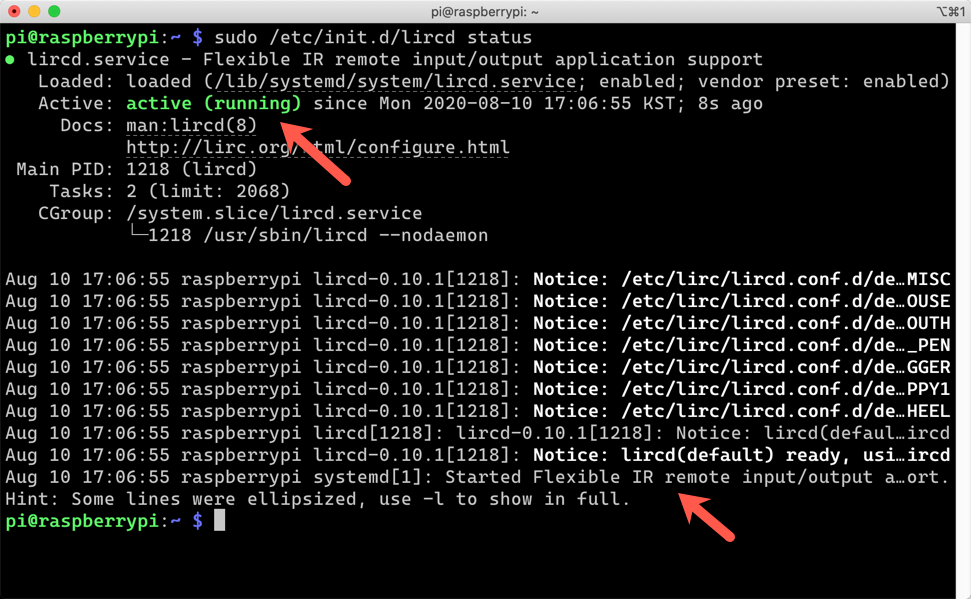
sudo /etc/init.d/lircd status
It’s now working!
Remote Controller Registration
This is the most important part of all. I have to register the remote controller I’m going to use.
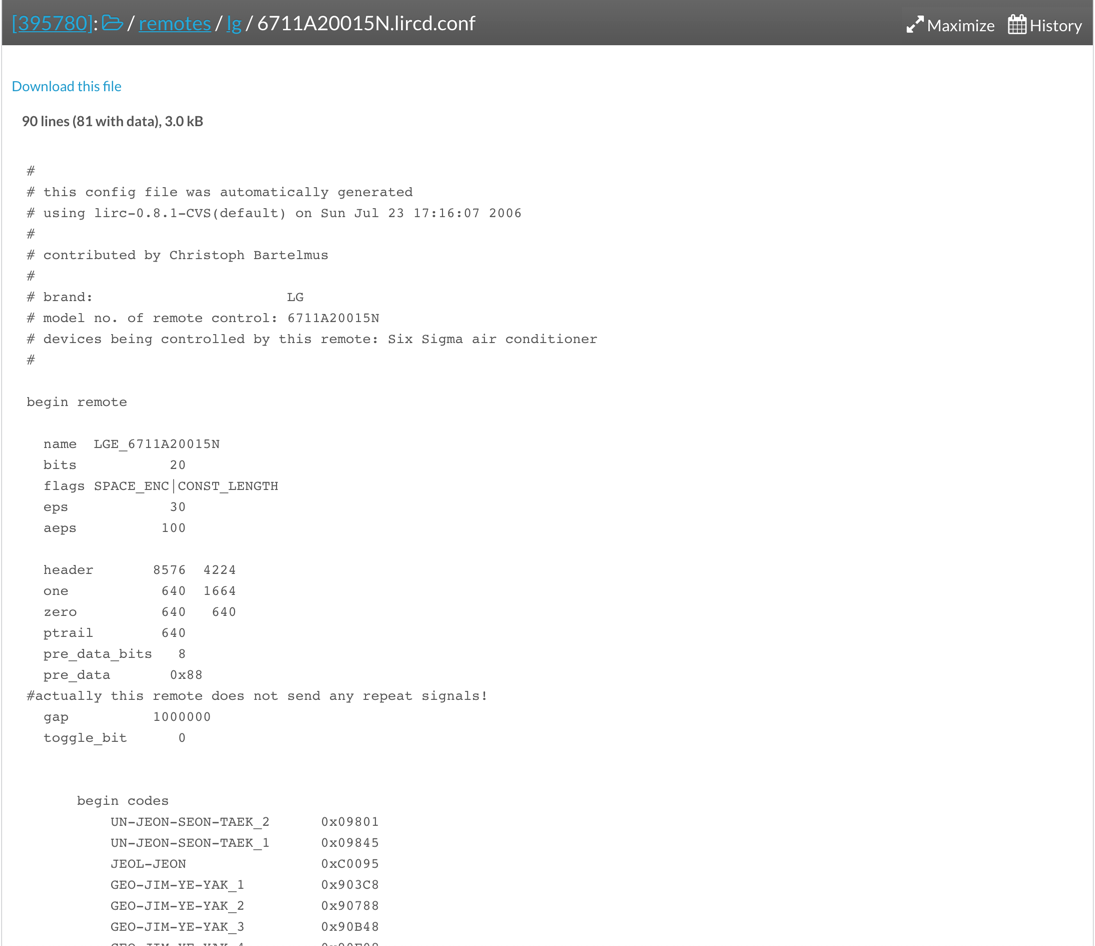
Use Remote Controller Database for Registration
The easiest and promising way to register the remote controller is to visit Remote Controller Database website, search the remote controller and download it. For example, as long as you know the remote controller model name, it can be found on the database. I just searched up any LG air-conditioner.
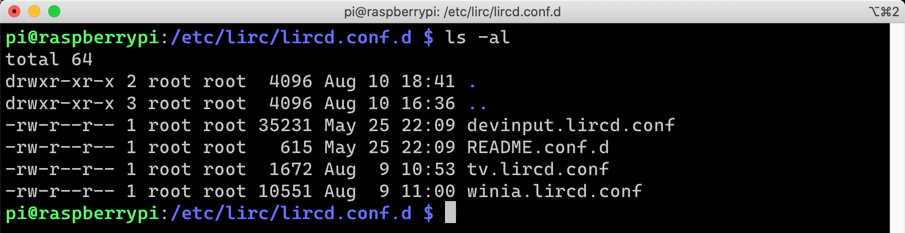
If you can find your remote controller details, download it and copy it to the designated location.
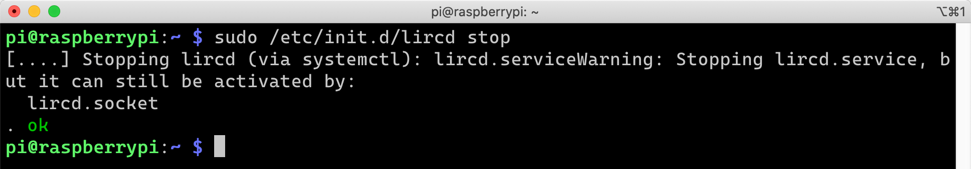
Not every remote controller has been registered to this database. If you can’t find yours, you should create it by yourself. Winia makes my air-conditioning system, but it doesn’t exist on the database. I’ve got a local branded TV which doesn’t exist on the database either. I had to create them. To create the configuration file, Raspberry PI should be double-checked whether the IR sensor on it captures the remote controller signal or not. First of all, stop the LIRC service.
sudo /etc/init.d/lircd stop
Run the following command to wait for the incoming IR signals.
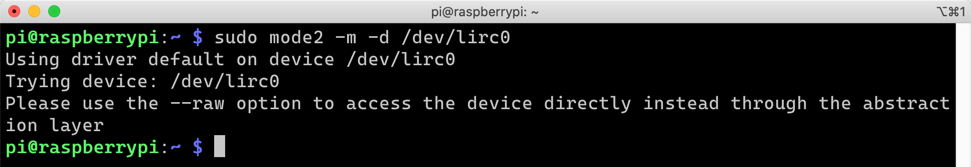
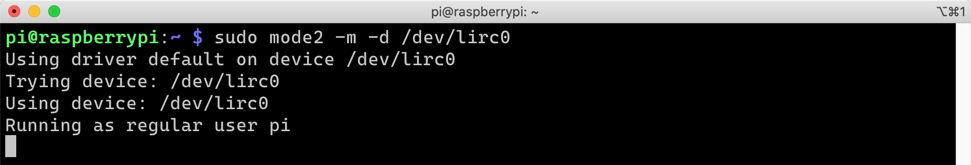
sudo mode2 -m -d /dev/lirc0
If you’re unlucky, you’ll get the following error message. Yeah, it’s me.
It’s because both the IR sender and receiver are active. At this time, we only need the receiver, which is for capturing the IR signals. Disable the sender part. Open the bootloader.
sudo nano /boot/config.txt
We used to have both gpio-ir and gpio-ir-tx activated. As we don’t need the sender part, for now, update the file like below (line #5-6).
# Uncomment this to enable infrared communication.
#dtoverlay=gpio-ir,gpio_pin=17
#dtoverlay=gpio-ir-tx,gpio_pin=18

dtoverlay=gpio-ir,gpio_pin=18
#dtoverlay=gpio-ir-tx,gpio_pin=17
Once completed, reboot Raspberry PI using the command, sudo reboot. Once it’s restarted, run the following command so that you can confirm it works.
sudo mode2 -m -d /dev/lirc0
Now it’s waiting for your IR signal input. Locate your remote controller close to Raspberry PI and punch some buttons. You’ll find out the remote controller buttons are captured.
We confirm the incoming signals are properly captured. It’s time to generate the remote controller file. Enter the following command:
sudo irrecord -d /dev/lirc0 --disable-namespace
Once running the command above, it gives you instructions to follow. Record your buttons by following the instruction. By the way, the recording application sometimes doesn’t work as expected. Yes, I was in the case. I had to use a different approach. Instead of using irrecord, I had to use mode2 to capture the button signals. Run the following command:
sudo mode2 -m -d /dev/lirc0 > .lircd.conf
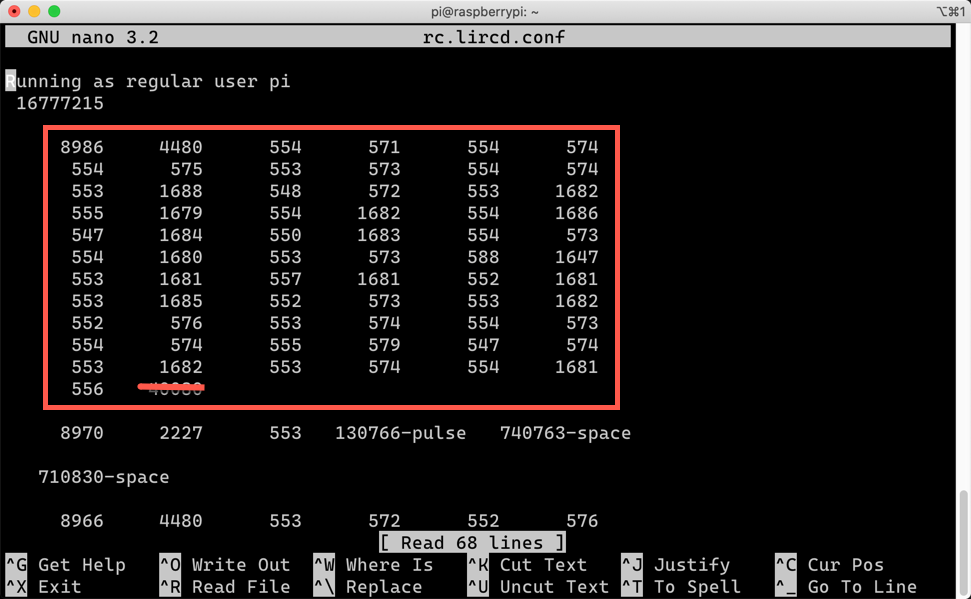
Record the button signals. When you open the <remote_controller_name>.lircd.conf file, you’ll be able to see some number blocks.
The number blocks in the red rectangle are the set of the controller button. As the last value of the box is an outlier, delete it. And remove all others except the number blocks. Let’s add the followings around the number blocks.
Add begin remote ... begin raw_codes before the fist number block. They are from the random file on the database. I don’t know what the exact value might look like. I just copied and pasted them to the file (line #1-13).
Give each number block a name like name SWITCH_ON. Each button has a different value represented by the number block. Therefore give those names extensively (line #15, 22).
Add the lines at the end of the final number block (line #29-30).
begin remote

  name   tv
  flags RAW_CODES
  eps            25
  aeps          100

  ptrail          0
  repeat     0     0
  gap    20921


  begin raw_codes

    name SWITCH_ON
     8996     4451      552      574      551      576
      552      576      551      579      550      575
      553     1683      577      550      551     1683
      ...
      564

    name SWITCH_OFF
     9000     4453      578      548      580      548
      578      549      556      572      552      576
      552     1683      577      551      550     1683
      ...
      573

  end raw_codes
end remote
After this update, copy this file to the LIRC directory.
Remote controllers have been registered. Open the bootloader for the update.
sudo nano /boot/config.txt
Update the IR sender part (line #5-6).
# Uncomment this to enable infrared communication.
#dtoverlay=gpio-ir,gpio_pin=17
#dtoverlay=gpio-ir-tx,gpio_pin=18

dtoverlay=gpio-ir,gpio_pin=18
dtoverlay=gpio-ir-tx,gpio_pin=17
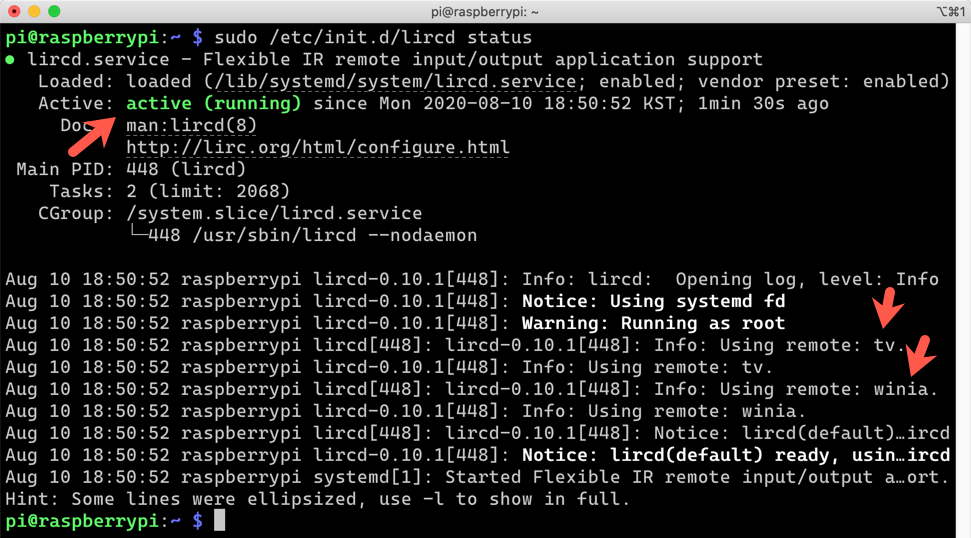
Run sudo reboot to reboot Raspberry PI. Check whether the LIRC module is working or not.
sudo /etc/init.d/lircd status
We can confirm that the LIRC module read both air-conditioner and TV configurations and ready for use!
Theoretically, we can register as many remote controllers as we like!
Controlling Air-Conditioner and TV on Raspberry PI
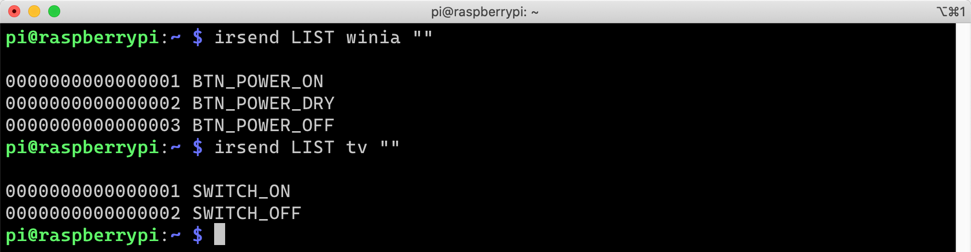
Let’s check whether the remote controller on Raspberry PI. Enter the following command to see the list of names that I can execute.
irsend LIST ""
I’ve registered both air-conditioner (winia) and TV (tv). The following screenshot is the result I’ve got. Each remote controller has more buttons, but I only need two buttons – on and off. Therefore, I only registered those two buttons.
OK. Let’s run the command.
irsend SEND_ONCE tv SWITCH_ON
Although the terminal shows nothing, I actually turn on and off the TV.
Can you see the TV being turned on and off?
Unfortunately, I can make my air-conditioner working. I might have incorrectly captured the IR signal for the air-conditioner. But TV works! To me, the air-conditioner was the top priority. I should spend more time to get it working. If I have a more sophisticated device to capture the IR signal, it would be better.
So far, we have walked through how Raspberry PI turns into a remote controller that turns on and off home appliances. In the next post, I’ll build a Power App and Power Automate that talks to Azure Functions app to access to the remote controller (Raspberry PI) outside the home network.
This article was originally published on Dev Kimchi.
This article is contributed. See the original author and article here.
Final Update: Sunday, 16 August 2020 19:47 UTC
We’ve confirmed that all systems are back to normal with no customer impact as of 8/16, 19:30 UTC. Our logs show the incident started on 8/16, 16:56 UTC and that during the 2 hours and 34 minutes that it took to resolve the issue small set of customers in West Central US Region experienced issues with data access in Log Analytics and also issues with delayed or missed Log Search Alerts.
Root Cause: The failure was due to issues with one of the dependent services.
Incident Timeline: 2 Hours & 34 minutes – 8/16, 16:56 UTC through 8/16, 19:30 UTC
We understand that customers rely on Azure Log Analytics as a critical service and apologize for any impact this incident caused.


Recent Comments