
by Scott Muniz | Jun 24, 2020 | Uncategorized
This article is contributed. See the original author and article here.
Lenovo’s ThinkCentre M75n combines power, productivity, and intelligent edge computing to respond to our new world of remote work.
The post Lenovo’s smallest desktop serves up power and increased productivity appeared first on Microsoft 365 Blog.
Brought to you by Dr. Ware, Microsoft Office 365 Silver Partner, Charleston SC.
by Scott Muniz | Jun 24, 2020 | Uncategorized
This article is contributed. See the original author and article here.
The new, rugged Enduro series features MIL-810G and are designed for first responders as well as field and manufacturing workers.
The post Acer launches rugged Enduro lineup—and expands ConceptD series for creators appeared first on Microsoft 365 Blog.
Brought to you by Dr. Ware, Microsoft Office 365 Silver Partner, Charleston SC.
by Scott Muniz | Jun 24, 2020 | Uncategorized
This article is contributed. See the original author and article here.
One of the goals of Microsoft Productivity Score is to enable business decision makers and IT to have conversations around driving productivity through insights into how the organization works and how technology enables productivity. In a world where many people are working remotely, we heard from you that these conversations are more important than ever, and that you need to understand the impact this has on your organization. In the Productivity Score private , you have insights into areas like how people communicate, collaborate, and how their device experience and network connectivity contribute to productivity. To help you get even more insights and drive a more in-depth and relevant conversation in this new world of work, we are happy to share two new features: a special report focused on business continuity, and new features in Endpoint Analytics to help you diagnose and fix common support and performance issues and optimize software for best user experience, on Microsoft Endpoint Manager managed devices.
How are your devices contributing to productivity?
Of course, the key to understanding and improving your organization’s effectiveness at working and collaborating remotely are insights into the technology that underpins these experiences. That’s one important area where the Technology Experience side of Productivity Score shines. One of the key categories in Technology Experience is Endpoint Analytics, which helps you understand how your users’ productivity can be impacted by performance and health issues with your endpoint hardware and software, while providing recommended actions to remediate them.
Endpoint performance and health issues persist because IT admins don’t have adequate visibility into their root causes and level of impact. The majority of these issues can be attributed to a combination of:
- Legacy or under-spec’ed hardware
- Software configurations that aren’t optimized for the end user experience
- Issues caused by configuration changes and updates
To give you the visibility, insights, and actions you need to tackle these productivity killers, we are excited to announce additional enhancements to Endpoint Analytics and make them available in public preview!
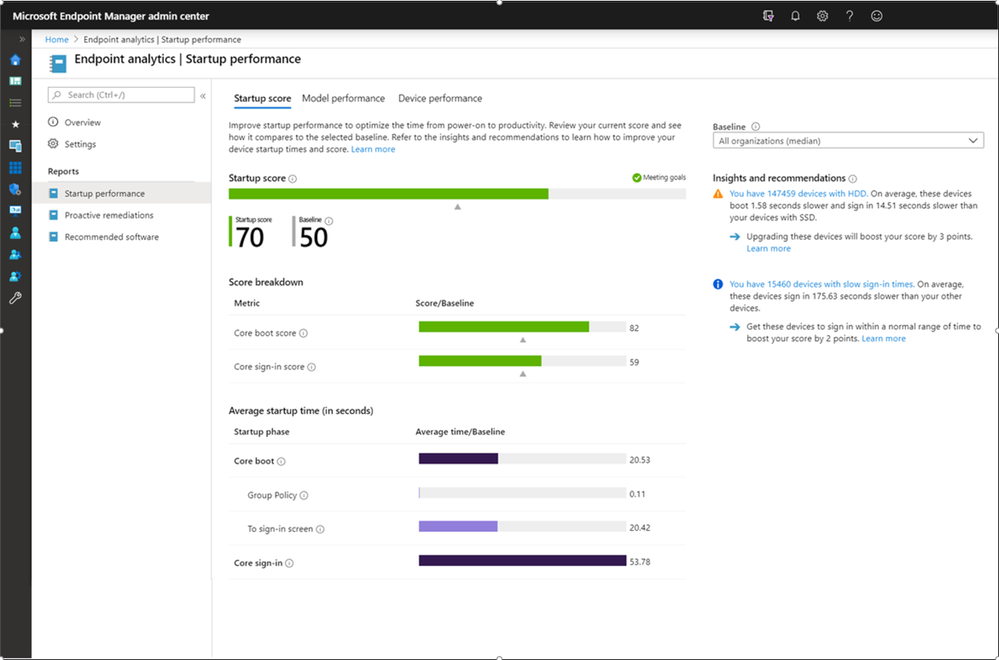
As we shared in April, Endpoint Analytics currently focuses on three areas to help you address endpoint related user experience problems. The first area is startup performance, which evaluates the time it takes the PCs in your environment to go from power-on to a responsive desktop. It gives you a score and a benchmark that allows you to quickly see how you compare to other organizations, along with recommended actions to improve startup times. Endpoint Analytics also provides recommended software advice to help optimize OS and Microsoft software versions for best user experience. This includes management and deployment services such as Configuration Manager, Intune, and Autopilot, as well as Azure Active Directory and Windows 10. Lastly, there are proactive remediation scripts – packages that can detect and fix common support issues on your endpoints, often before users realize there’s a problem.
These insights and actions empower you to improve the user experience, lower help desk costs, demonstrate business impact, and make informed device procurement decisions.
 Endpoint Analytics Startup Performance screen
We are also happy to announce the public preview supports both Intune and Configuration Manager managed devices. So wherever you are in your management journey, we’ll meet you there. In addition, we’ve simplified the process for enabling endpoint analytics to a single button in the Microsoft Endpoint Management (MEM) admin console, making it even easier and faster to get into the preview.
How are people adapting to remote work?
Due to the global shift to working remotely, you’ve told us that your organizations’ collaboration norms have changed, but you are not exactly sure how and by how much. The new business continuity report can help you answer this with visibility and insights at an organizational level into these changes. Using data from the Microsoft Graph, the report complements information in Productivity Score and usage analytics with insights into collaboration and work patterns to help you answer questions like “How is ‘business as usual’ changing?” and “How are employees adapting to the disruption of working remotely?”
One way to measure how “business as usual” is changing is to analyze how employees are collaborating. The report provides you with visibility on how the use of in Microsoft 365 has changed, giving you a better picture of the “new normal.” Another way to see this change is to understand employee engagement and measuring how working hours are shifting. Without the physical separation between home and work, employees may experience difficulty adapting, with the potential for burnout. The report also provides insight into the effectiveness of remote meetings, content collaboration, and employees’ sense of community and belonging.
 Home page of business continuity report
Want to get started and learn more?
To learn more about the business continuity report, check out the documentation at https://aka.ms/bcrps. The report is rolling out to tenants that have at least 100 active Exchange users over the next few days. Please note that this report is temporary and will not be a permanent feature of Productivity Score.
For details on Endpoint Analytics, visit the public preview page at https://aka.ms/uea. To enable Endpoint Analytics follow the instructions within the card in Productivity Score or you can visit https://aka.ms/endpointanalytics to take you to the MEM admin console and click the start button.
by Scott Muniz | Jun 24, 2020 | Uncategorized
This article is contributed. See the original author and article here.
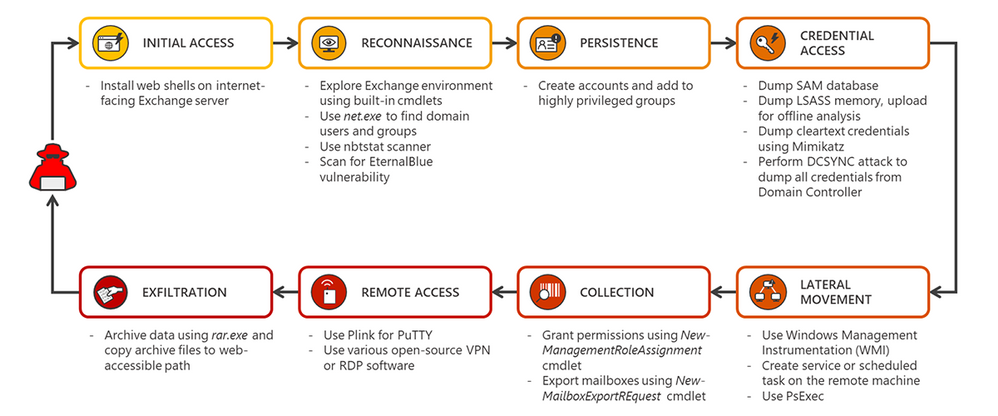
Exchange servers are high-value targets for attackers. If compromised, Exchange servers provide a unique environment that could allow attackers to perform various tasks using the same built-in tools or scripts that admins use for maintenance. This is exacerbated by the fact that Exchange servers have traditionally lacked antivirus solutions, network protection, the latest security updates, and proper security configuration, often intentionally, due to the misguided notion that these protections interfere with normal Exchange functions.
In April, Exchange-specific behavior-based detections in Microsoft Defender ATP showed attackers operating on on-premises Exchange servers using deployed web shells. The attacks used multiple fileless techniques, adding another layer of complexity to detecting and resolving the threats, and demonstrating how behavior-based detections are key to protecting organizations.

Behavior-based blocking and containment capabilities in Microsoft Defender ATP stop many of the malicious activities associated with Exchange server attacks. In addition, endpoint detection and response (EDR) sensors provide visibility into other suspicious and malicious activities on Exchange servers. Detections are reported as alerts. The new alert page presents data in an investigation-driven approach meant to empower SecOps teams to easily investigate and take actions.

To get more guidance on improving defenses against Exchange server compromise, read Defending Exchange servers under attack.
by Scott Muniz | Jun 24, 2020 | Uncategorized
This article is contributed. See the original author and article here.
Disclaimer
Limited additional language support is currently available to 50% of Microsoft 365 Subscribers in the Beta level of the Office Insider program using Excel on Windows or MacOS. Additional language support for Excel on the Web will be coming later.
For a little over a year, English language Stocks and Geography data types have been available to customers who have English as an editing language in their workbooks. We have heard from customers that they’re benefiting from using data types to get current stock prices and demographic information into Excel. We are excited to bring these capabilities to a broader audience by supporting Stocks and Geography in French, German, Italian, Portuguese, and Spanish!
Getting Started
You will have access to any data type that is supported by one or more languages chosen in your authoring language settings. For English, Spanish, French, German, Italian, and/or Portuguese this includes both Stocks and Geography.
You can ensure data types will be created in the language you want by setting it as your preferred authoring language. You can read more in this support article about language settings in Office.
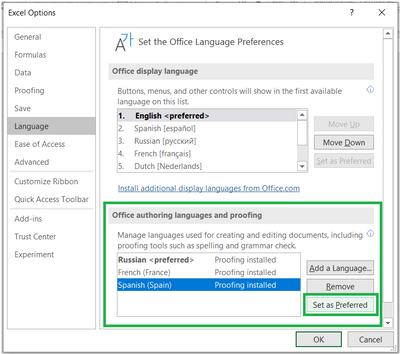
- For Office on Windows, you can change this setting in File > Options > Language. Under Office authoring languages and proofing select the language you want and then select Set as Preferred.
- For Office on MacOS, you can configure this by going to the Apple menu, choosing System Preferences > Language & Region and set the desired language to be your preferred language by dragging it to the top of the Preferred languages list.
NOTE: You may have to restart Excel twice after making a change to your language settings to ensure the data type service registers the change.

Converting to a Data Type
After you have configured your language settings, start by typing some text in a cell like the name of a city or country for geographic data, or ticker symbol for stock data. Read more about Stocks and Geography data types. You should type your text in the language you will be using for the data type.
Using the Data Tab
Select your cells containing text and go to the Data tab in the ribbon. You should see two buttons in the Data Types group. Select the button corresponding to the data type you want to create. Note that the text for these buttons will match your Office display language (for the screenshot below this is English).

When authoring in a supported language, the Stocks and Geography buttons will look like the above.
If you configure your settings so that your preferred authoring language is not supported for a data type, but a supported language is included in the list, the data types created will fall back to using one of the supported languages. You can see an example of this in the button-like UI in the screenshot below. The language name in parentheses helps you to know the data types will be created in Spanish. (In this case the Display Language is set to English, while Russian is currently set as the preferred language and Spanish is included in the list)

Exploring the data type
After you convert text into the Stocks or Geography data types, an icon will appear in the cell. Click the icon to see the card. The card reveals a list of fields and corresponding values. Depending on the data, there could be numerous field/value pairs that you can see and work with. You will be able to see that the field names and values are created in the configured language.


Data types persist in the language that they were created in. Changing your language settings and performing a data connection refresh of the data will not change the display name, field name, or field values in the data type.
Using fields in formulas
Fields like “Nombre”, “Precio”, and “Población” are the buckets of information that make up the data type. When a data type is created in a certain language, it means that all the field names and field values for that data type are forever in that language.
You can use these field names as identifiers in formulas and calculations using dot notation. For example, the formula “=A1.Población” uses dot notation after referencing a cell A1 then using a period followed by the field name. This will result in the formula evaluating, and the field value being shown in the cell.

Another way to insert a field into the workbook is by using the “Insert Data” button on the card, on a cell, or next to a table.

Remember, the data type persists in language it was created in. If you change your language settings or send your workbook to someone working in a different language, the field names and formulas using dot notation will not change.
Availability Notes
Additional language support for Stocks and Geography in Spanish, French, German, Italian, and Portuguese is available to 50% of Microsoft 365 Subscribers in the Beta level and will be available to users of other channels later this year. I will update this blog as these become more widely available.
In the meantime, please provide feedback either in the comments below or Please note our translations and coverage of data may not be perfect, please let us know how we can improve.
Stay engaged with the Excel product team and the Excel community:
Kaycee Reineke (@KayceeSue)
Program Manager, Excel

Recent Comments