This article is contributed. See the original author and article here.
The Workplace Analytics team is excited to announce our feature updates for July 2020. (You can see past blog articles here). This month’s update covers our latest features:
- Updated Business continuity report
- New organizational network analysis person-to-person query and metrics
- Increased number of non-global partitions
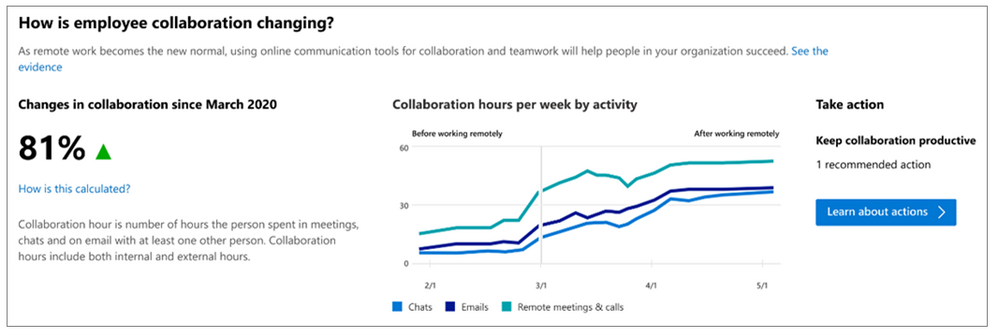
Updated Business continuity report
The Workplace Analytics team has updated and relocated the Business continuity report that we released in May of this year. This report now appears in the Microsoft Productivity Score area of the M365 admin center. It is available to any M365 customer tenant that has at least 100 active M365 users. Microsoft admins can access the report and they can share it with their business leaders.
The Business continuity report can help leaders answer questions such as:
- How the shift to remote work has changed their employees’ collaboration habits:
- How employees are adapting to the shift in work-life balance:
- Whether remote meetings are structured for effective decision-making:
- How ideation and knowledge-sharing are affected by remote work:
- Whether employees, though physically separated, maintain a sense of community at work:


In addition, if you’re an admin or a senior leader, the Business continuity report helps you understand how Workplace Analytics can help you learn and do more. Selecting Take action on any of these reports opens a pane that describes both general best practices and the benefits of diving deeper into information that Workplace Analytics can provide. For example, the pane shown in the following screenshot gives more information about the question “Are employees able to create and share effectively while working remotely?”:

New ONA person-to-person query and metrics
Workplace Analytics now offers a new organizational network analysis (ONA) query and two new accompanying metrics. Our first ONA query, a person query, lets analysts measure Influence, a score of how well connected you are in the company.
This new query, the ONA person-to-person query, lets you measure the strength of connections through the following new metrics:
- The Strong ties metric measures how many strong and tight engagements a person has had. For example, a “strong tie” between a manager and a direct report reflects the amount of direct collaboration they have over time. Typically, a person has only a few strong ties because such ties take more effort to maintain.
- The Diverse ties metric measures how varied and how broad the person’s connections are. A person need not have much direct collaboration with their diverse ties, so it’s easy to have more diverse ties than strong ties. Diverse ties present good sources of fresh and varied information from across the company.
Measuring the quality, or strength, of an employee’s connections can help improve organizational functioning in various ways. For example, a manager’s effectiveness can improve if the manager has high network strength. Such managers have tight connections with their direct reports, they tend to have strong peer connections, and they have the right kind of connections outside the team. Well-connected managers know how to point inquisitive employees to the right people in their network. This makes it more likely that these employees become star performers, which of course reflects positively on the manager.
As for non-managers, the most effective employees also excel in part because of strong and rich networks. When high performers have broader internal networks, it indicates that they have relationships across a more diverse set of people, which promotes system-level thinking and problem solving.
Determine Strong ties and Diverse ties
After you run the ONA person-to-person query, results appear in a .csv file, which you can open in Excel. They show the quality of the relationship between two specific (but de-identified) people. Each row shows the information for a pair of people between whom a tie exists, or existed, over the time period of the query.
In the query results, the first columns describe the initiator of the tie, the next columns describe the other participant in the tie, and the last columns give the results, in the form of the Strong ties and Diverse ties metrics. For example:

These metrics are presented as scores:
- StrongTieScore. Sort on this column to find employees with the highest scores. These high scores represent strong ties between the two individuals.
- DiverseTieScore. Sort on this column to find employees with the highest scores. These high scores represent diverse ties between the two individuals.
- StrongTieType. This column is present to help analysts quickly find the strongest ties. It contains values of 0, 1, or 2. The value 1 indicates that this row clearly indicates a strong tie — roughly, the top 10% of ties, by strength. “2” indicates a tie that is significant but less strong. “0” indicates a tie that’s not that strong.
- DiverseTieType. This column is present to help analysts quickly find the most diverse ties. IT contains values of 0, 1, or 2. The value 1 indicates that this row clearly indicates a diverse tie — roughly, the top 10% of ties, by diversity. “2” indicates a tie that is significant but less diverse. “0” indicates a tie that’s not that diverse.
For complete information about running this query and interpreting its results, see ONA person-to-person queries.
Increased number of non-global partitions
Based on feedback from multiple customers, we are now increasing to ten the number of non-global partitions, each of which can contain 10,000 licensed users. This feature is available to customers who have a current engagement with Workplace Analytics Customer Solutions.
You might want to take advantage of this new feature if any of the following apply to your organization:
- You need to create additional partitions based on business units, subsidiaries, or geographies.
- You need more than five partitions so that you can hide sensitive columns that should not be exposed to specific teams or because you have different personas who analyse your data.
Note the following about this change:
- Partitions remain an on-request feature for organizations that have a Customer Solutions engagement.
- Although non-global partitions are acquiring the new limit of 10,000 licensed users, there remains no maximum number of licensed users for the Global partition.
- This change has no impact on older partitions, even those that have more than 10,000 licensed users.
Brought to you by Dr. Ware, Microsoft Office 365 Silver Partner, Charleston SC.

Recent Comments