This article is contributed. See the original author and article here.
When sellers follow a predefined set of activities from day to day, they will usually be more productive. Sales managers and other experienced sellers define these best practices, or sequences, to guide sellers and ensure they follow business processes. However, these sequences must constantly evolve, and the best way to make improvements is to understand their effectiveness. Dynamics 365 Sales Premium recently announced a preview of the reporting capability for sequences.
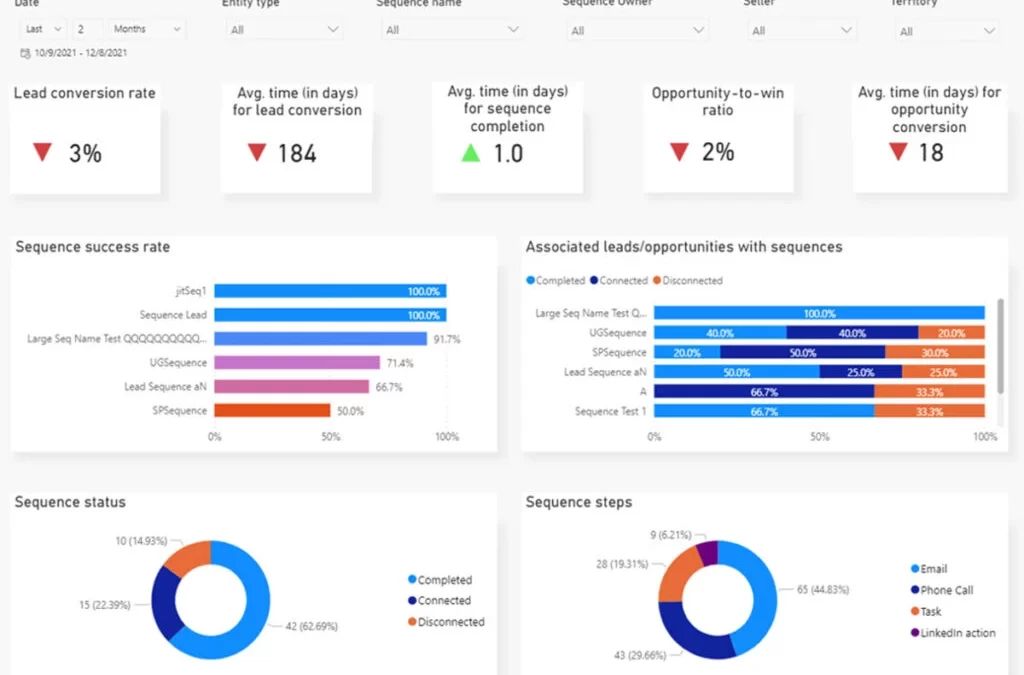
Sales acceleration reporting (preview) offers a performance dashboard for sequences that provides sales managers with the right information to measure the efficacy of the defined sequences. The dashboard helps them compare the success rate of each sequence and analyze the effectiveness of the related activities. Key data points embedded within the metric charts help managers manage seller activities.
The administrator can enable these embedded Microsoft Power BI reports and they are available at no additional cost for customers with Dynamics 365 Sales Premium licenses.
Improve the sales process
Sequences help sales managers implement a standardized sales process. Even though each sequence reflects years of experience and input, it is necessary to constantly revise and optimize the sales processes by monitoring performance. The dashboard provides the success rates of the sequences, aligned to the business KPIs. The dashboard also helps the manager compare sequences. They can also identify poorly performing sequences through the reports. Standard filters let the manager drill into specific data.
The dashboard reports offer the following key features:
- Check the conversion success rates of the leads and opportunities associated with sequences
- Compare sequences and check the number of associated leads and opportunities
- Monitor the time taken to complete the guided sales activities
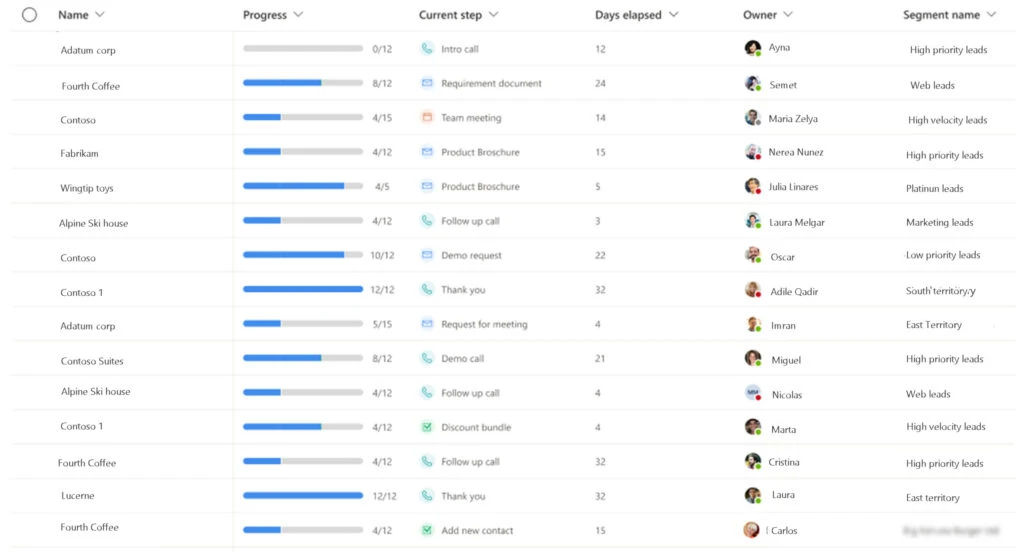
A sales manager can view the leads related to a particular sequence to monitor a seller’s activities and ensure adherence to the standardized sales processes.
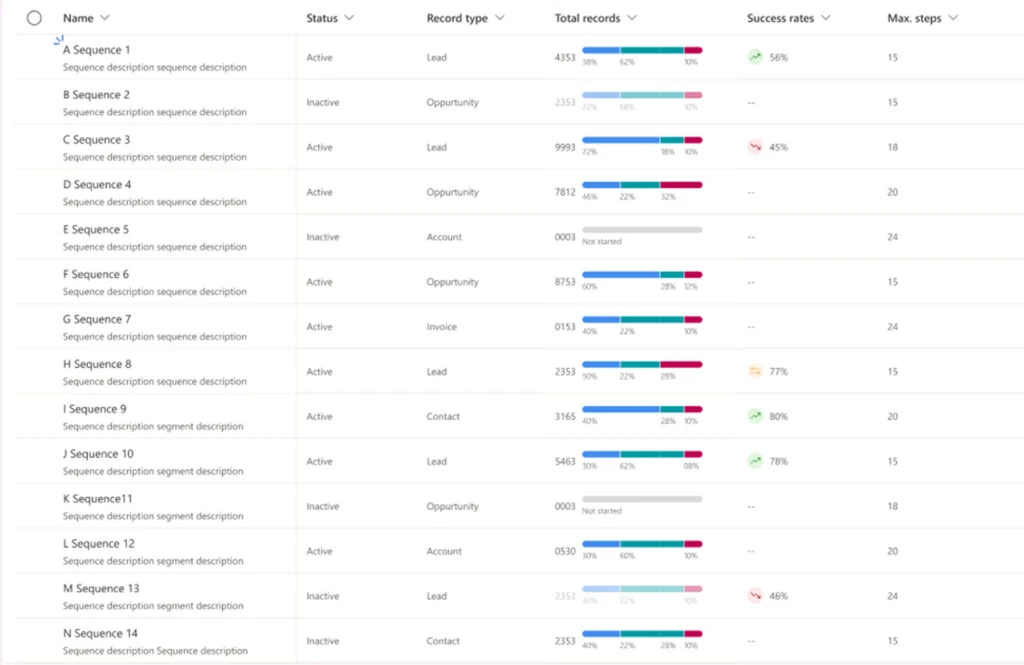
The sequence stats page offers a grid view for sequences that helps managers compare different sequences and brainstorm ways that a sales process can be more productive.
Ensure high completion rates of seller activities
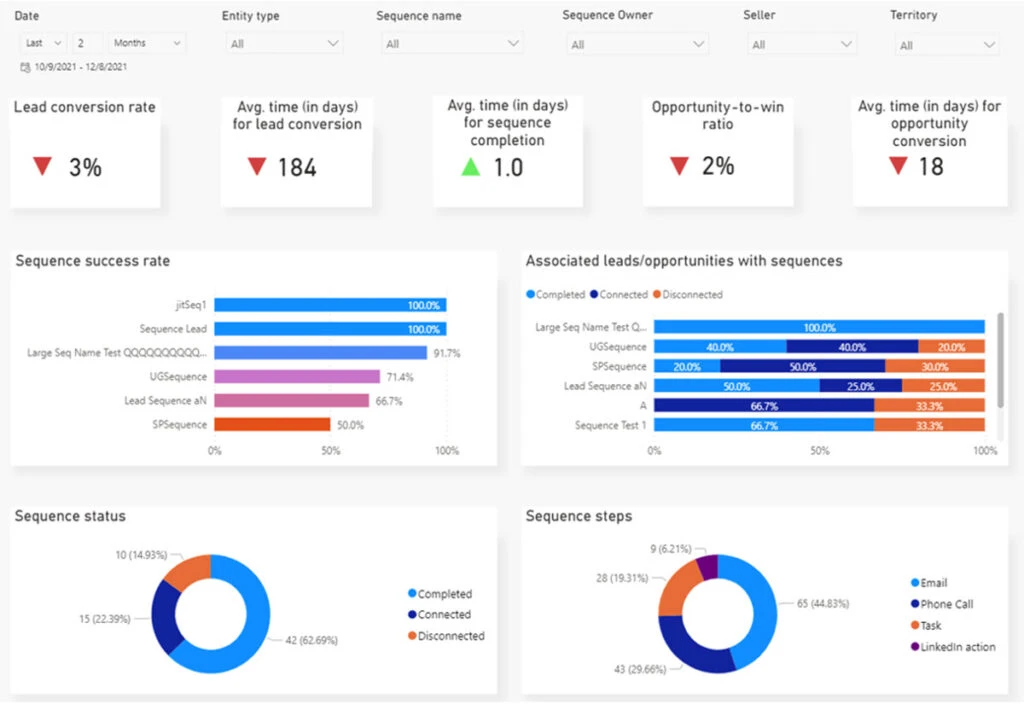
Sales managers can monitor seller activities with charts in the dashboard. They can filter activities using the following parameters:
- Date range
- Entity type, such as lead or opportunity
- Sequence name and owner
- Seller
- Territory
By using these metric charts, the manager can identify the channels that are working well and see where improvements can be made. With the help of the activity status charts, the manager can easily recognize the completion rate of activities and decide where to focus to meet expectations. The chart for email engagement tracks the effectiveness of that activity.
Sales managers can find the following key insights with the reporting page:
- Identify the channels that are most used in the sales process
- Track the completion of sales process activities
- Measure the effectiveness of email engagement
Next steps
- To enable sequences in your environment, you need Dynamics 365 Sales Premium or the Sales Insights Add-in for Dynamics 365 Sales.
- Learn more about how to set up and run sales acceleration reporting in the documentation.
- Read this blog post about the value of creating a sales cadence and how to use sequence designer to implement it.
The post Use a performance dashboard to optimize seller activities appeared first on Microsoft Dynamics 365 Blog.
Brought to you by Dr. Ware, Microsoft Office 365 Silver Partner, Charleston SC.

Recent Comments