This article is contributed. See the original author and article here.
Last year at Microsoft Ignite, we announced the public preview of the Visio Data Visualizer add-in for Excel. This year, we are thrilled to announce that the add-in is now generally available. The Data Visualizer add-in, which is also now available for the first time from a dedicated button in the Excel ribbon, lets you create diagrams—basic flowcharts, cross-functional (swim lane) flowcharts, and org charts—from data directly in Excel.

All you need to get started is a Microsoft work or student account—no Visio subscription is required. This means you can create, view update, edit, share, and print your diagram all for free. If you are using personal accounts like hotmail.com or outlook.com, you can still use the add-in with limited capabilities.
Getting started
The Data Visualizer add-in is available for Excel on Windows (2016 or later), Mac (2016 or later), and Excel for the web with a work or school account. To start using it:
- Open Excel and create a new blank workbook.
- Save the workbook to a OneDrive or SharePoint location. (This step is optional but recommended).
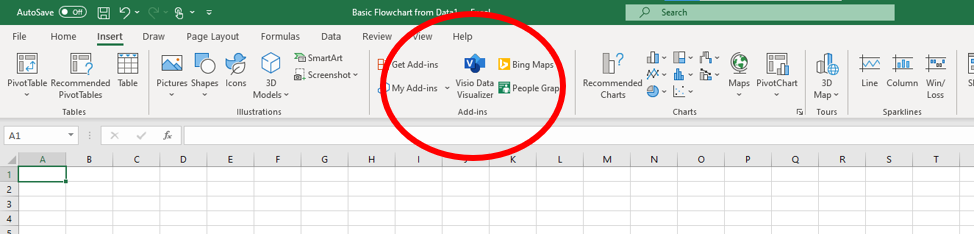
- Add ‘Visio Data Visualizer’ add-in from Insert > Get Add-ins section. You can start from an add-in ready template as well from File > New. Search for keywords like flowchart, org chart etc. in the ‘Search for online templates’ box.
- If you see a security message regarding the add-in, select Trust this add-in.
Using the add-in
You can find a bevy of information about the Data Visualizer add-in on our support site.
The add-in comes with a variety of data-linked samples. Each diagram category comes with a variety of data linked samples in different themes and layouts for your you get started. You can customize the diagram by bringing your own data. When you’re done, click Refresh in the add-in to see your changes sync with the data-linked diagram—all right within Excel.
If you have a Visio Plan 1 or Visio Plan 2 license, you can do even more with your Data Visualizer diagrams, like adding text, applying design themes, and making other modification, using either Visio desktop or Visio for the web. To edit a diagram in Visio for the web, click Edit in the add-in menu bar.
Recent updates
Earlier this year, we announced several updates to the add-in that make it even easier for everyone to use Data Visualizer. Here they are again.
Add-in ready templates:
There are three new templates for the Data Visualizer add-in—one for basic flowcharts, one for cross-functional flowcharts, and one for organizational charts—that offer repeatable models for expediting the diagram creation process. You can find each of these in the Excel backstage or at templates.office.com.

To get started with these templates in the backstage, open Excel > File > New. Type “flowchart” in the search bar, choose your preferred template, and select Create.
To get started from the tempaltes.office.com, search for “Basic flowchart from data,” “Organization chart from data,” or “Cross-functional flowchart from data.” Again, choose your preferred diagram from the available templates and select Download.
Please note that these new templates are currently only available to Microsoft 365 subscribers on the monthly channel in the Excel backstage. If you’re on the semi-annual channel, you’ll be able to access the new templates from there once they’re deployed; alternatively, you can start using the templates now by downloading them from templates.diagrams.com.
Extended language support:
The add-in now supports all 26 languages available in Visio for the web, extending Data Visualizer to your colleagues around the world. Some of these languages include English, French, German, Spanish, Italian, Dutch, Arabic, Hebrew, Japanese, Korean, Hindi, and Russian. The language defaults to the one set on your browser. If your admins set a tenant-level language, that will take precedence over the browser-level setting.

Single sign-on integration:
If you are already signed into Excel with your work or school account, you’ll be automatically signed into the Data Visualizer add-in, too, bringing more convenience to the add-in experience. For semi-annual channel users, single sign-on will be deployed with next release; until then, those users can continue with manual sign-in.

Centralized deployment:
Lastly, we have made it easier for admins to deploy the add-in directly from the Microsoft 365 admin center. This is the recommended way for admins to deploy all add-ins (including the Data Visualizer add-in) to users in a group or the tenant. You can find all the details for using Centralized Deployment in this article. But for a quick tutorial, follow these steps.
- Log into the Microsoft 365 admin center. From the left sidebar, go to Settings > Add-ins > Deploy Add-in. This will open the add-in wizard.
- In the wizard, select Choose from Store and type “Microsoft Visio Data Visualizer” in the search bar. Then, select the add-in.
- Read through the licensing terms and privacy policy.
- Choose if you want to enable the add-in for your entire organization or just a limited number of users or groups. Once decided, deploy the add-in, which will now appear on the Add-ins list.

If you’d like to learn more about any of these enhancements, please read our blog post from July.
Today marks the opening day of Microsoft’s first all-digital Ignite conference. Check our the Data Visualizer skilling video at aka.ms/Visio/DataVisualizer for additional tips, tricks, and information. All the other Visio conference videos can be found on the Ignite Virtual Hub.
As always, please send us your feedback about the Data Visualizer add-in—or any other Visio feature for that matter—through UserVoice. And keep visiting Tech Community for all the latest Visio news, including more from Ignite in the coming days.
Brought to you by Dr. Ware, Microsoft Office 365 Silver Partner, Charleston SC.

Recent Comments