This article is contributed. See the original author and article here.
Under (hopefully) rare circumstances, after developing a training script and thorough local testing, it can still happen that the same script fails when executed on a remote AML compute target. Here, we are sharing some best practices around how to debug remote workloads on Azure ML.
Debugging remote workloads can be broken down into two basic steps:
- Getting access to a command line on the remote AML compute target.
- Using command line tools for investigation and debugging.
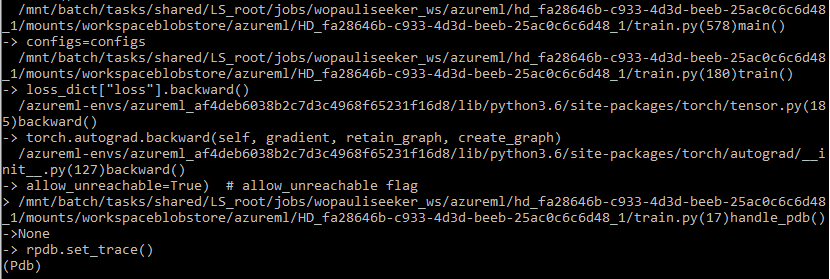
The below snapshot shows what your stack trace may look like if you follow the steps below.

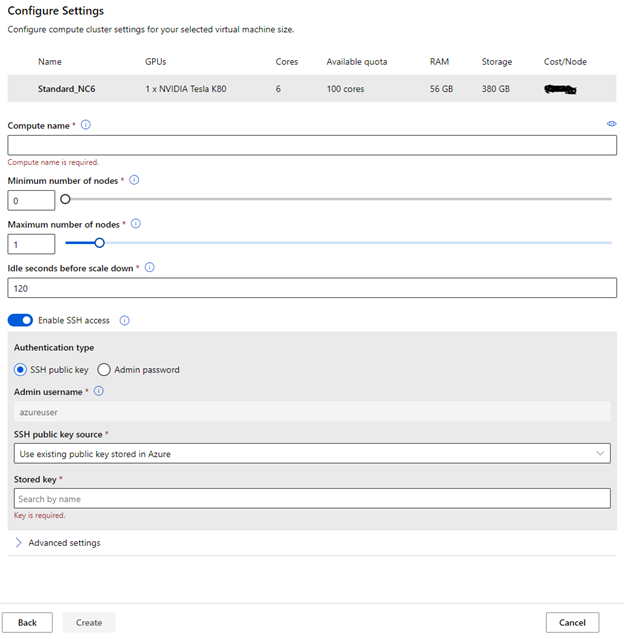
Enable SSH access to your remote AML compute target
You will have to be able to connect to your remote compute target via SSH. By default, SSH access is disabled, so you will have to make sure you enable SSH access during the provisioning of the compute target. The below screenshot shows where to find the option.

RPDB
For debugging, we are using rpdb, a wrapper for the python debugger pdb, which is part of the Python Standard Library. Using rpdb, we can connect to and debug a running process.
One of the really convenient aspects of using rpdb is that it won’t affect the performance of your training script, unless you set a breakpoint, either statically or dynamically, as described below.
Software Prerequisites
We recommend you install at least two packages, to make this work (1) rpdb and (2) netcat-openbsd. You can simply add rpdb to the pip packages of your Conda dependencies in your AzureML environment.
Netcat-openbsd can be either installed manually, when you start to debug a run (after attaching to running docker container, see below), or you can build a custom docker image for execution. For this we recommend starting from one of the base Docker images for AzureML containers, and simply adding netcat-openbsd to the packages installed by the apt package manager.
Modifying the training script for debugging
Consider the following two scenarios. Either you want to set a breakpoint and then step through the code from there, to see what is going wrong. In this case, you only have to add one line to your training script (towards the top of the training script) to create a breakpoint:
import rpdb; rpdb.set_trace()
Alternatively, you may have a training script that just somehow gets stuck, without failing. In this case, you can’t really set a breakpoint, because you don’t know where the script gets stuck. We experienced this situation when we trained a pytorch model, using multiple workers for data loading. A thread contention caused the data loader to hang, and we needed to know where/why the thread contention occurred.
If you are facing this situation, you can make some modifications to the training script that will allow you to send a signal to the training script, which will dynamically set a breakpoint at the current execution step, so you can use the debugger to figure out what is going on. To do this, add the following code to your training script.
import rpdb
def handle_pdb(sig, frame):
    rpdb.set_trace()
Then add the following code, so that the above method is called when SIGUSR1 signal is sent to the python process.
if __name__ == "__main__":
    import signal
    signal.signal(signal.SIGUSR1, handle_pdb)
Connect to your remote compute target
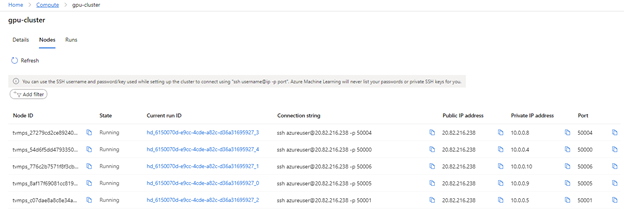
This first thing to do is to go to the list of nodes on your compute target, identify the run that you would like to debug, and copy the “Connection string”. This is shown in the following screenshot.

You can then use the terminal of your choice (e.g. Anaconda command prompt) to connect to the node via SSH. Once logged in, you can use the usual commands for investigation (e.g. vmstat, top, free)
Debugging
If you want to dig deeper, you can attach to the docker container, inside of which your training script is running, and start debugging.
To do this, you have to first get the ID of the running container (using “docker ps”). Then you can attach to it, using “docker attach <id>”. If you didn’t include netcat-openbsd in your docker image, you can do so after attaching to the container.
If you set a breakpoint (by adding the line “rpdb.set_trace()”, mentioned above), you can now connect to the process, using the binary “nc” from the netcat-openbsd package: “nc 127.0.0.1 4444”. This will get you to pdb for debugging. If you have never used pdb, just type “help”, and you will find the usual commands for debugging.
If you followed the above instructions, for handling the SIGUSR1 signal, you can also send a signal, to pause execution, and continue in debug mode. In other words, this allows you to set a breakpoint at the current execution step.
First, send the signal: kill -n 10 <proc_id> (or kill -s SIGUSR1 <proc_id>)
Then you can use “nc” again for connecting to pdb.
Note: Think carefully before you start debugging a running process with pdb, because you won’t be able to leave the pdb session without killing the process. You can, however, keep the job running, you’ll just have to leave the pdb session open.
Closing remarks
We hope you found this blog post useful. Our intent was to demystify remote workloads, getting you closer to debugging them like you would, if your scripts were being executed locally. Please leave questions and suggestions in the comments below!
Brought to you by Dr. Ware, Microsoft Office 365 Silver Partner, Charleston SC.


Recent Comments