This article is contributed. See the original author and article here.
py-spy is a sampling profiler for Python programs. It lets you visualize what your Python program is spending time on without restarting the program or modifying the code in any way. py-spy is extremely low overhead: it is written in Rust for speed and doesn’t run in the same process as the profiled Python program. This means py-spy is safe to use against production Python code.
py-spy works on Linux, OSX, Windows and FreeBSD, and supports profiling all recent versions of the CPython interpreter (versions 2.3-2.7 and 3.3-3.9).
This article shows a demonstration of how to use py-spy to run sampling profiler for your Python application running in Linux App Service.
Step 1: Install py-spy for your Python application
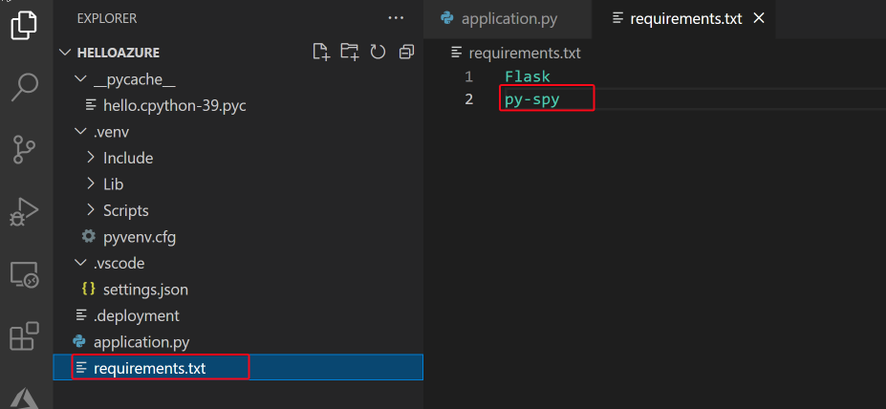
In your Python application project, find your requirements.txt file. Add “py-spy” in the file.
This is the only change we need to make. No other code changes are required.
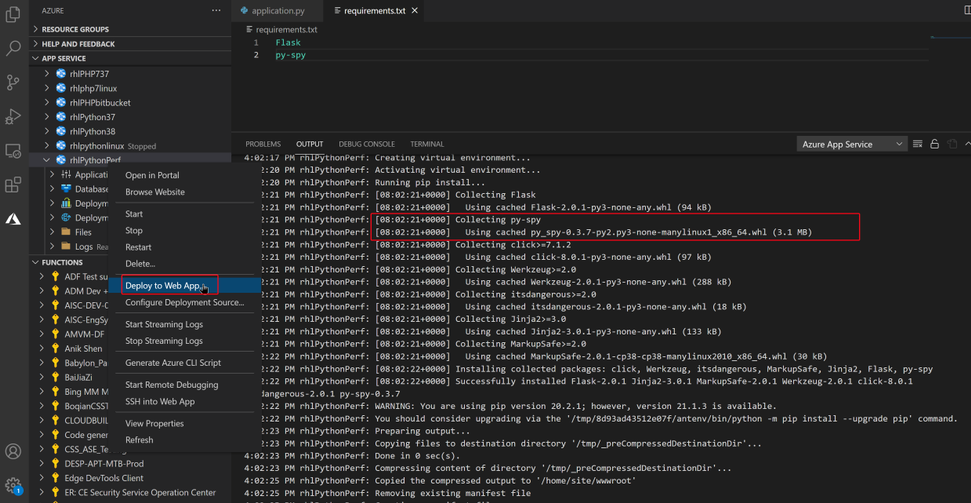
Step 2: Deploy your application to Azure Web App.
When deploying the code, Azure orxy build will help us install the py-spy package.
Step 3: Run live performance monitor for your application
Py-spy allow us attach to a running Python process, and monitor its performance.
The tool is similar to the Unix top command, it shows a live view of what functions are taking the most time in your python program, . Running py-spy with:
- Login to your Linux App Service WEBSSH, https://<webapp-name>.scm.azurewbsites.net/
- First use “ps aux | grep python” command to find your python process ID.

- Run “py-spy top –pid <python process id>”
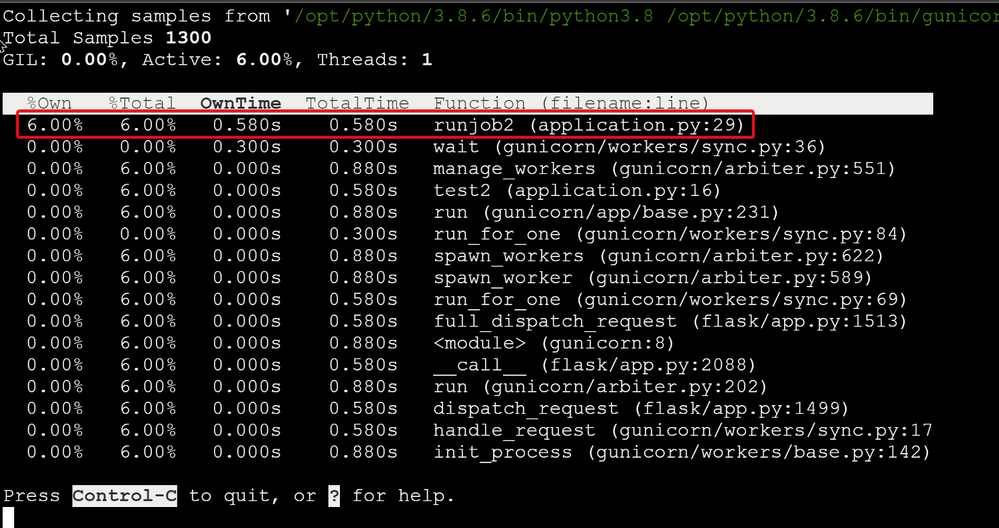
Here is my sample Python code. When I access http://<webapp-name>.azurewebsites.net/test2, I can see a lot cpu time consumed by my runjob2() function.
import time from flask import Flask app = Flask(__name__) @app.route("/") def hello(): runjob() return "Hello Azure, from Flask!" @app.route("/test1") def test1(): return "Hello Test1!" @app.route("/test2") def test2(): runjob2() return "Hello Test2!" def runjob(): counter = [] for i in range(0,5): test() counter.append(i) print (counter) def runjob2(): for i in range(0,10): i = i+1 time.sleep(1) def test(): print(">>>>>start test") time.sleep(1) print("<<<<<<<done")
Step 3: Use record command to record profiles to a flame graph file
- Run the following command in your WEBSSH
root@a029b609b0ab:~# py-spy record -o /home/profile.svg –pid 38
It will start profiling record: - Run tests in your web browser
For example, access different web pages, http://<webapp-name>.azurewebsites.net/test1 and http://<webapp-name>.azurewebsites.net/test2 - Use Control-C to exit the performance profiling.
The recorded svg file will be found in the path you defined in the “py-spy record” command
- Go to your App Service File manager to download the .svg file
https://<webapp-name>.scm.azurewebsites.net/newui/fileManager#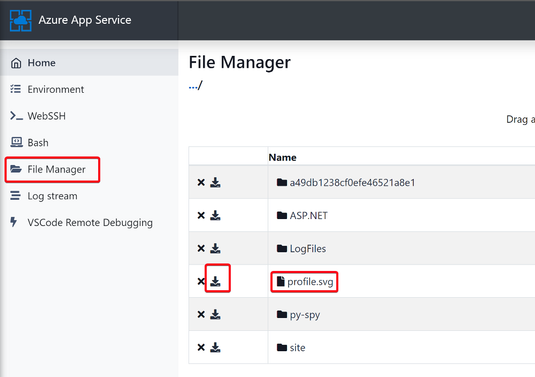
- Open the downloaded .svg file in any of web browser in your local machine. You will see the flame graph of your python application.
Flame graphs are a visualization of profiled software, allowing the most frequent code-paths to be identified quickly and accurately.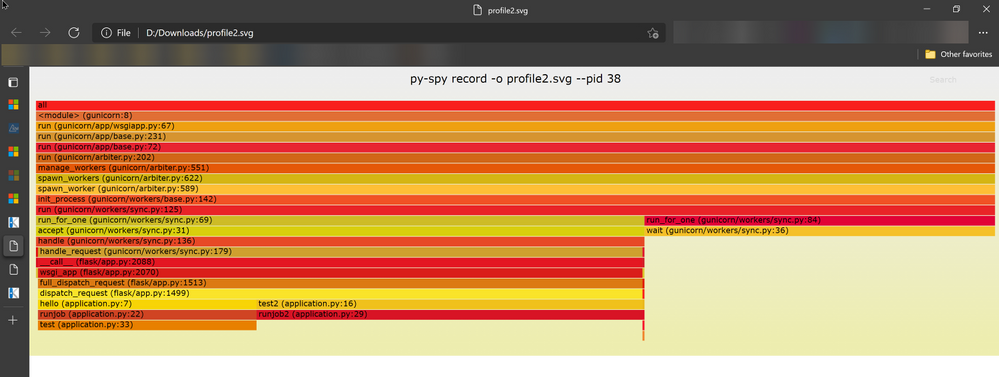
Brought to you by Dr. Ware, Microsoft Office 365 Silver Partner, Charleston SC.


Recent Comments