This article is contributed. See the original author and article here.
How to Use TSSv2 to Collect Data and Analyze to Solve High CPU Issues.
Hello everyone, this is Denzel Maxey with the Windows Performance Team. I found a tool that actively collects different data based on scenarios and streamlines the data collection process. Drumroll – introducing TSSv2 (Troubleshooting Support Script). In my job, I see a lot of High CPU cases and collecting an ETL trace using TSSv2 with Xperf aka WPR for high CPU has been fundamental in resolving issues.
I’d like to share some instructions, methods, and just insight on the tools in general that should be able to empower IT professionals resolve issues. This post will show how the TSSv2 tool can work with the Windows Performance Recorder. Tssv2 also works with several tools as it is very powerful but will focus on collecting a WPR trace using TSSv2 when regarding a case of High CPU. I can even give you a great clue as to how to collect data for Intermittent High CPU cases as well! Once you have the data, I’ll then show you how to analyze it. Lastly, I’ll provide some additional resources on WPA Analysis for High CPU.
Data Collection Tools:
TSSv2
TSSv2 (TroubleShootingScript Version 2) is a code signed, PowerShell based Tool and Framework for rapid flexible data collection with a goal to resolve customer support cases in the most efficient and secure way. TSSv2 offers an extensible framework for developers and engineers to incorporate their specific tracing scenarios.
WPR/Xperf
“Windows Performance Recorder (WPR) is a performance recording tool that is based on Event Tracing for Windows (ETW). The command line version is built into Windows 10 and later (Server 2016 and later). It records system and application events that you can then analyze by using Windows Performance Analyzer (WPA). You can use WPR together with Windows Performance Analyzer (WPA) to investigate particular areas of performance and to gain an overall understanding of resource consumption.”
*Xperf is strictly a command line tool, and it can be used interchangeably with the WPR tool.*
_________________________________________________________________________________________________________________________________________________
Let’s Dig in!
You notice your server or device is running with 90% high CPU. Your users are complaining of latency and poor performance. You have checked task manager, resource monitor or even downloaded and opened process explorer but there is still no exact root resource glaring you in the face. No worries, a WPR will break down the high CPU processes a bit more. You could even skip straight to this step in the future when you get comfortable working with these tools.
Setup TSSv2
Running a TSSv2 troubleshooting script with the parameters for either WPR or Xperf gathers some granular Performance data on machines showing the issue. In the example below, I’m saving the TSSv2 the script to D: (note the default data location is c:MS_Data). In your web browser, download TSSv2.zip found here: http://aka.ms/getTSSv2 or you can Open an Administrative PowerShell Prompt and paste the following commands.
The commands below will automatically prepare the machine to run TSSv2 by taking the following actions in the given order:
- Create D:TSSv2 folder
- Set the PowerShell script execution policy to RemoteSigned for the Process level (process level changes only affect the current PowerShell window)
- Set TLS type to 1.2 and download the TSSv2 zip file from Microsoft
- Expand the TSSv2.zip file into D:TSSv2 folder
- Change to D:TSSv2 folder
Ex: Commands used below
md D:TSSv2
Set-ExecutionPolicy -scope Process -ExecutionPolicy RemoteSigned -Force
[Net.ServicePointManager]::SecurityProtocol = [Net.SecurityProtocolType]::Tls12
Start-BitsTransfer https://aka.ms/getTSSv2 -Destination D:TSSv2TSSv2.zip
Expand-Archive -LiteralPath D:TSSv2TSSv2.zip -DestinationPath D:TSSv2 -force
cd D:TSSv2
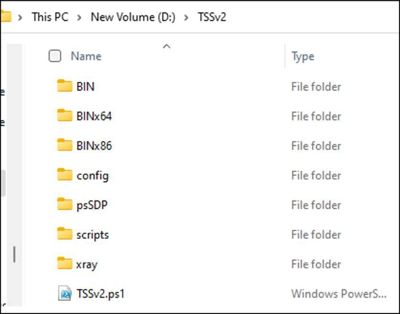
The result will be a folder named TSSv2 on drive D.
_________________________________________________________________________________________________________________________________________________
Gathering Data using TSSv2
Open an elevated PowerShell window (or start PowerShell with elevated privileges) and change the directory to this folder:
cd D:TSSv2
*WARNING* Data collection grows rather large quickly. You should have at least 30% of your overall RAM available as hard drive space. (Example, if you have 8 GB of RAM – then the file can grow to 2.5GB or larger in c:MS_Data.)
What are some of the scenarios you might have? Maybe you want to manually collect the trace. Or, once you start the trace, let it automatically stop.
How about limiting the file size? There are several parameters you can adjust for your needs.
Below you will find variations of using TSSv2 to collect WPR data in high CPU occurrences. You have an option of using either WPR or Xperf commands. Please review all of them before deciding which trace to take for your environment.
- Scenario In State: The issue is currently occurring, and the following example needs user intervention to stop the trace. The WPR can grow to 80% of the memory with the example commands listed below.
.Tssv2.ps1 -WPR General *** (run it for 60 seconds to no longer than 3 minutes)
.Tssv2.ps1 -Xperf CPU ***(run it for 60 seconds to no longer than 3 minutes)
Default location of saved data will be C:MS_Data.
The prompt will tell you when to reproduce the issue, just simply enter “Y” will END the trace at that time and the machine in question experiencing high CPU will then finish running the data collection.

2. Scenario In State but you wanted to limit the size and length of time: The issue is currently occurring, the following example does NOT need user intervention to stop the trace. Default location of saved data will be C:MS_Data. The Xperf can grow to 4GB of memory and runs for 5 minutes with the setting below:
The issue is currently occurring; the following example does NOT need user intervention to stop the trace. Default location of saved data will be C:MS_Data. The Xperf can grow to 4GB of memory and runs for 5 minutes with the setting below:
.TSSv2.ps1 -Xperf CPU -XperfMaxFileMB 4096 -StopWaitTimeInSec 300
Note: you can modify the size and length of the trace by increasing or decreasing -XperfMaxFileMB and -StopWaitTimeInSec when it is initially run.
3. Scenario In State but you wanted to limit the size and length of time with data saved on Z:Data drive instead of C (default): The issue is currently occurring; the following example does NOT need user intervention to stop the trace. The Xperf can grow to 4GB of the memory and runs for 5 minutes with the setting below and this time the resulting data will be saved on Z:Data. You simply need to add -LogFolderPath Z:Data to the command.
.TSSv2.ps1 -Xperf CPU -XperfMaxFileMB 4096 -StopWaitTimeInSec 300 -LogFolderPath Z:Data
4. Scenario Intermittent High CPU and having a tough time capturing data. These commands will wait for the CPU to reach 90%, start a trace and will stop the file from growing larger than 4GB while running for 5 minutes.
.TSSv2.ps1 -Xperf CPU -WaitEvent HighCPU:90 -XperfMaxFileMB 4096 -StopWaitTimeInSec 300
5. Scenario Intermittent High CPU and having a tough time capturing data. These commands will wait for the CPU to reach 90%, start a trace and will stop the file from growing larger than 4GB while running for 100 seconds (1.5 minutes roughly).
.TSSv2.ps1 -Xperf CPU -WaitEvent HighCPU:90 -StopWaitTimeInSec 100
Pro Tip: You can check for additional Xperf/WPR commands by doing a search on the help command files in TSSv2 by typing
.tssv2.ps1 -help at the prompt. When prompted to enter a number or keyword, type xperf or wpr, hit enter, and you will see the options.
Ex: Finding help with keyword ‘xperf’

Be sure to wait for the TSS script to finish, it can take some time (even an hour to finish writing out). The PowerShell will return to type line and the folder in C:MS_Data should zip itself when complete. The location of the script does not determine the location of the data collected. Wait for trace to finish before exiting PowerShell.
Reminder: Just like in the first trace, you learned data collection grows rather large quickly. You should have at least 30% of your overall RAM available as hard drive space. (Example, if you have 8 GB of RAM – then the file can grow to 2.5GB or larger on c:MS_Data.)
_________________________________________________________________________________________________________________________________________________
You have the Data – Now Let’s look at it!
Download the Windows ADK (Windows Assessment and Deployment Kit) from this location: Download and install the Windows ADK | Microsoft Learn. Once you download the Windows ADK, you want to install the Windows Performance Toolkit. Double click on the executable (.exe) to start the installation process.
Uncheck everything except Windows Performance Toolkit, then click Install.

Opening the data in the C:MS_DATA folder
When complete, the WPR general TSSv2 command should have placed all collected data into this folder in a zipped file. You will know the trace ran all the way without stopping prematurely when you see the zipped file in C:MS_DATA. There will also be a message in the PowerShell window when the diagnostic completes stating the name of and the location of the zipped file.

You will need to unzip the zipped file to analyze the WPR trace (.etl file). After unzipping, you will see several data collections that can be helpful with analysis. However, what you mainly want to look at is the .etl file which is usually the biggest file located in the folder.

If you double click the .ETL file it should open in WPA, but if not, you can manually open the newly installed application and navigate to your file.
Example:

You can open the .ETL file to view the WPR trace with WPA (Windows Performance Analyzer) by clicking File, Open and then browsing to the file that ends with the .ETL extension.
Step 1. Open WPR trace in WPA and load the Public Symbols. You may also see symbols listed from the NGEN folder (NGEN is part of the folder name) collected at the time the WPR trace was run.
Select Trace, select Configure Symbol Paths

Click + sign (highlighted in yellow in screenshot below), then enter Public Symbol Path: srv*c:symbols*https://msdl.microsoft.com/download/symbols

More Information: (Symbol path for Windows debuggers – Windows drivers | Microsoft Learn)
Once symbols are configured simply click Load Symbols

Step 2. Once open you should see a window similar to the screenshot below. Expand Computation on the left and drag CPU Usage (Precise) to the right side of the Window to load. You can also double click CPU Usage (Precise) for it appear on the right side.

You will then see space on the top graph showing, “Trace Rundown”. That is not needed as it is the part of the trace where the script was finishing up. To get rid of the trace rundown, highlight the area before trace rundown, right click, then select “Zoom”.

You can now filter down each of your processes deeper and deeper to try to locate a potential root cause of what is spiking the CPU. You can look to see which processes have the highest weight over on the right-hand columns to help pinpoint the highest consumers. It may be a specific kernel driver, application, process, etc. but this should help point you in the right direction of what process is exhausting resources.
These are the columns you will want to focus on:
Left of Gold Bar:
New Process
New Thread ID
New Thread Stack
Right of Gold Bar:
Waits (us) Sum
Waits (us) Max
Count:Waits Sum
%CPU Usage Sum

You can see the CPU usage is the highest due to CPUSTRESS.EXE in this example. As you filter down you can see the threads that contribute to the max CPU spike which sums up to the top number of the CPU usage. This can be helpful to find out which threads, functions and modules are called for the root cause.
Conclusion:
Once again this is not the only use for the TSSv2 tool. But as you can see, the WPR/Xperf trace is a very complex tool that gathers data from a simple PowerShell command. This can be very efficient for troubleshooting. This article is not meant to cover all scenarios. However, I highly recommend taking some time to learn more about what TSSv2 can accomplish as this tool will only continue to get better.
If at any point you get stuck don’t hesitate to open a support case with Microsoft.
Additional Information:
Information on TSSv2 and alternative download site:
Information about Windows Performance Toolkit
Windows Performance Toolkit | Microsoft Learn
For Reference:
Download Windows Assessment Toolkit which contains Windows Performance Analyzer
Download and install the Windows ADK | Microsoft Learn
How to setup public symbols
Symbol path for Windows debuggers – Windows drivers | Microsoft Learn
Brought to you by Dr. Ware, Microsoft Office 365 Silver Partner, Charleston SC.

Recent Comments