This article is contributed. See the original author and article here.
Monitoring your database is one of the most crucial tasks to ensure a continued healthy and steady workload. Azure Database for PostgreSQL, our managed database service for Postgres, provides a wealth of metrics to monitor your Postgres database on Azure. But what if the very metric that you are after is not yet available?
Worry not because there are ample options to easily create and monitor custom metrics with Azure Database for PostgreSQL. One solution you can use with Postgres on Azure is Datadog’s custom metrics.
If you are not familiar with Datadog, it is one of many solid 3rd party solutions that provides a set of canned metrics for various technologies, including PostgreSQL. Datadog also enables you to poll our databases with the help of custom queries to emit custom metrics data to a central location where you can monitor how well your workload is doing.
If you don’t yet have a Datadog account, no problem, you can use a free trial Datadog account to try out everything I’m going to show you in this post.
What is bloat in Postgres & why should you monitor it?
As a proud owner of a PostgreSQL database, you will inevitably have to experience and manage bloat, which is a product of PostgreSQL’s storage implementation for multi-version concurrency control. Concurrency is achieved by creating different versions of tuples as they receive modifications. As you can imagine, PostgreSQL will keep as many versions of the same tuple as the number of concurrent transactions at any time and make the last committed version visible to the consecutive transactions. Eventually, this creates dead tuples in pages that later need to be reclaimed.
To keep your database humming, it’s important to understand how your table and index bloat values progress over time—and to make sure that garbage collection happens as aggressively as it should. So you need to monitor your bloat in Postgres and act on it as needed.
Before you start, I should clarify that this post is focused on how to monitor bloat on Azure Database for PostgreSQL – Single Server. On Azure, our Postgres managed database service also has a built-in deployment option called Hyperscale (Citus)—based on the Citus open source extension—and this Hyperscale (Citus) option enables you to scale out Postgres horizontally. Because the code snippets and instructions below are a bit different for monitoring a single Postgres server vs. monitoring a Hyperscale (Citus) server group, I plan to publish the how-to instructions for using custom monitoring metrics on a Hyperscale (Citus) cluster in a separate/future blog post. Stay tuned! Now, let’s get started.
First, prepare your monitoring setup for Azure Database for PostgreSQL – Single Server
If you do not already have an Azure Database for PostgreSQL server, you may create one as prescribed in our quickstart documentation.
Create a read-only monitoring user
As a best practice, you should allocate a read-only user to poll your data from database. Depending on what you want to collect, granting pg_monitor role, which is a member of pg_read_all_settings, pg_read_all_stats and pg_stat_scan_tables starting from Postgres 10, could be sufficient.
For this situation, we will also need to GRANT SELECT for the role to all the tables that we want to track for bloat.
CREATE USER metrics_reader WITH LOGIN NOSUPERUSER NOCREATEDB NOCREATEROLE INHERIT NOREPLICATION CONNECTION LIMIT 1 PASSWORD 'xxxxxx';
GRANT pg_monitor TO metrics_reader;
--Rights granted here as blanket for simplicity.
GRANT SELECT ON ALL TABLES IN SCHEMA public to metrics_reader;
Create your bloat monitoring function
To keep Datadog configuration nice and tidy, let’s first have a function to return the bloat metrics we want to track. Create the function below in the Azure Database for PostgreSQL – Single Server database you would like to track.
If you have multiple databases to track, you can consider an aggregation mechanism from different databases into a single monitoring database to achieve the same objective. This how-to post is designed for a single database, for the sake of simplicity.
The bloat tracking script used here is a popular choice and was created by Greg Sabino Mullane. There are other bloat tracking scripts out there in case you want to research a better fitting approach to track your bloat estimates and adjust your get_bloat function.
CREATE OR REPLACE FUNCTION get_bloat ()
                RETURNS TABLE (
                                database_name NAME,
                                schema_name NAME,
                                table_name NAME,
                                table_bloat NUMERIC,
                                wastedbytes NUMERIC,
                                index_name NAME,
                                index_bloat NUMERIC,
                                wastedibytes DOUBLE PRECISION
)
AS $$
BEGIN
                RETURN QUERY SELECT current_database() as databasename, schemaname, tablename,ROUND((CASE WHEN otta=0 THEN 0.0 ELSE sml.relpages::FLOAT/otta END)::NUMERIC,1) AS tbloat,CASE WHEN relpages < otta THEN 0 ELSE bs*(sml.relpages-otta)::BIGINT END AS wastedbytes,iname, ROUND((CASE WHEN iotta=0 OR ipages=0 THEN 0.0 ELSE ipages::FLOAT/iotta END)::NUMERIC,1) AS ibloat,CASE WHEN ipages < iotta THEN 0 ELSE bs*(ipages-iotta) END AS wastedibytes FROM (SELECT schemaname, tablename, cc.reltuples, cc.relpages, bs,CEIL((cc.reltuples*((datahdr+ma-(CASE WHEN datahdr%ma=0 THEN ma ELSE datahdr%ma END))+nullhdr2+4))/(bs-20::FLOAT)) AS otta,COALESCE(c2.relname,'?') AS iname, COALESCE(c2.reltuples,0) AS ituples, COALESCE(c2.relpages,0) AS ipages,COALESCE(CEIL((c2.reltuples*(datahdr-12))/(bs-20::FLOAT)),0) AS iotta FROM (SELECT ma,bs,schemaname,tablename,(datawidth+(hdr+ma-(CASE WHEN hdr%ma=0 THEN ma ELSE hdr%ma END)))::NUMERIC AS datahdr,(maxfracsum*(nullhdr+ma-(CASE WHEN nullhdr%ma=0 THEN ma ELSE nullhdr%ma END))) AS nullhdr2 FROM (SELECT schemaname, tablename, hdr, ma, bs,SUM((1-null_frac)*avg_width) AS datawidth,MAX(null_frac) AS maxfracsum,hdr+(SELECT 1+COUNT(*)/8 FROM pg_stats s2 WHERE null_frac<>0 AND s2.schemaname = s.schemaname AND s2.tablename = s.tablename) AS nullhdr FROM pg_stats s, (SELECT(SELECT current_setting('block_size')::NUMERIC) AS bs,CASE WHEN SUBSTRING(v,12,3) IN ('8.0','8.1','8.2') THEN 27 ELSE 23 END AS hdr,CASE WHEN v ~ 'mingw32' THEN 8 ELSE 4 END AS ma FROM (SELECT version() AS v) AS foo) AS constants GROUP BY 1,2,3,4,5) AS foo) AS rs JOIN pg_class cc ON cc.relname = rs.tablename JOIN pg_namespace nn ON cc.relnamespace = nn.oid AND nn.nspname = rs.schemaname AND nn.nspname <> 'information_schema' LEFT JOIN pg_index i ON indrelid = cc.oid LEFT JOIN pg_class c2 ON c2.oid = i.indexrelid) AS sml WHERE schemaname NOT IN ('pg_catalog') ORDER BY wastedbytes DESC;
END; $$
LANGUAGE 'plpgsql';
Confirm your read-only Postgres user can observe results
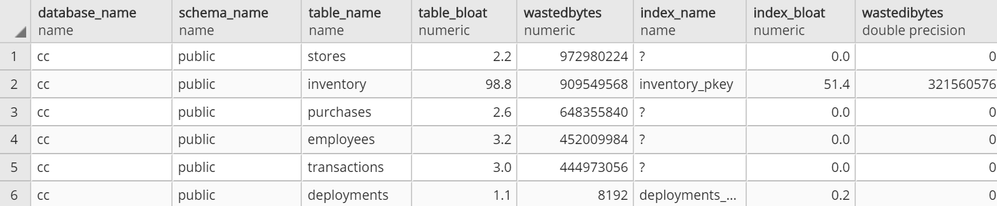
At this point, you should be able to connect to your Azure Database for PostgreSQL server with your read-only user and run SELECT * FROM get_bloat(); to observe results.

If you don’t get anything in the output, see if the following steps remedy this:
- Check your pg_stat records with
SELECT * FROM pg_stats WHERE schemaname NOT IN ('pg_catalog','information_schema'); - If you don’t see your table and columns in there, make sure to run
ANALYZE <your_table>and try again - If you still don’t see your table in the result set from #1, your user very likely does not have select privilege on a table that you expect to see in the output
Then, setup your 3rd party monitoring (in this case, with Datadog)
Once you confirm that your read-only user is able to collect the metrics you want to track on your Azure Postgres single server, you are now ready to set up your 3rd party monitoring!
For this you will need two things. First, a Datadog account. Second, a machine that will host your Datadog agent, to do the heavy lifting of connecting to your database to extract the metrics you want and to push the metrics into your Datadog workspace.
For this exercise, I had an Azure Linux virtual machine handy that I could use as the agent host, but you can follow quickstart guides available for Azure Virtual Machines to create a new machine or use an existing one. Datadog provides scripts to set up diverse environments, which you can find after you log in to your Datadog account and go to the Agents section in Datadog’s Postgres Integrations page. Following the instructions, you should get message similar to the following.

Next step is to configure datadog agent for Postgres specific collection. If you aren’t already working with an existing postgres.d/conf.yaml, just copy the conf.yaml.example in /etc/datadog-agent/conf.d/postgres.d/ and adjust to your needs.
Once you follow the directions and set up your host, port, user, and password in /etc/datadog-agent/conf.d/postgres.d/conf.yaml, the part that remains is to set up your custom metrics section with below snippet.
custom_queries:
       - metric_prefix: azure.postgres.single_server.custom_metrics
         query: select database_name, schema_name, table_name, table_bloat, wastedbytes, index_name, index_bloat, wastedibytes from get_bloat();
         columns:
           - name: database_name
             type: tag
           - name: schema_name
             type: tag
           - name: table_name
             type: tag
           - name: table_bloat
             type: gauge
           - name: wastedbytes
             type: gauge
           - name: index_name
             type: tag
           - name: index_bloat
             type: gauge
           - name: wastedibytes
             type: gauge
Once this step is done, all you need to do is to restart your datadog-agent sudo systemctl restart datadog-agent for your custom metrics to start flowing in.
Setup your new bloat monitoring dashboard for Azure Database for PostgreSQL – Single Server
If all goes well, you should be able to see your custom metrics in Metrics Explorer shortly!

From above you can export these charts to a new or existing dashboard and edit the widgets to your needs to show separate visuals by dimensions as table or index or you can simply overlay them as below. Datadog documentation is quite rich to help you out.

Knowing how your bloat metrics are trending will help you investigate performance problems and help you to identify if bloat is contributing to performance fluctuations. Monitoring bloat in Postgres will also help you evaluate whether your workload (or your Postgres tables) are configured optimally for autovacuum to perform its function.
Using custom metrics makes it easy to monitor bloat in Azure Database for PostgreSQL
You can and absolutely should track bloat. And with custom metrics and Datadog, you can easily track bloat in your workload for an Azure Database for PostgreSQL server. You can track other types of custom Postgres metrics easily in the same fashion.
One more thing to keep in mind: I recommend you always be intentional on what and how to collect, as metric polling can impact your workload.
If you have a much more demanding workload and are using Hyperscale (Citus) to scale out Postgres horizontally, I will soon have a post on how you can monitor bloat with custom metrics in Azure Database for Postgres – Hyperscale (Citus). I look forward to seeing you there!
Brought to you by Dr. Ware, Microsoft Office 365 Silver Partner, Charleston SC.

Recent Comments