This article is contributed. See the original author and article here.
Ever since IT Pros started building servers, we’ve been monitoring them – Are they operational? Are they responsive? Are they running out of disk space? The challenge is … who is monitoring the monitoring? While it’s common to send notifications to email, automatically create a helpdesk service ticket or even post an alert in a Microsoft Teams channel, I have to watch those other systems to know if a monitoring alert has fired (activated). Instead, I wanted a visual indicator that my monitoring has detected a problem, so I turned to my Phillips LIFX strip light.
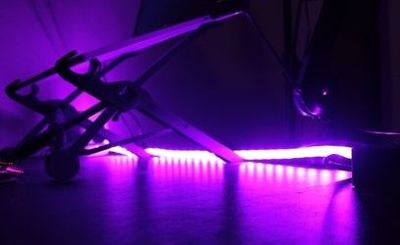 LIFX strip light
Previously, you needed to wrangle the LIFX HTTP API to achieve this integration with Azure Monitor, and this IT Pro doesn’t speak API. But LIFX is now available as connector (in Preview) for Azure Logic Apps, so we can tie this integration together in a no-code solution!
The Architecture
In essence, we’re building an architecture that looks like:
Monitor + Alert Threshold + Action Group (Action) + Logic App (Light state)
It pays to plan this out first, as it’s a little easier to build it out of order.
For this example, I’m going to configure:
Virtual Machine CPU greater than 50% – Flash the light strip purple
Service Health issue – set the light to solid red
While this won’t be an in-depth look into monitoring scenarios, you can go an explore metric alerts, log alerts and activity alerts to go beyond VM performance and include other Microsoft services. I like adding in Service Health too as those alerts work well for platform-wide components like Azure Active Directory or the general service that’s running your resource type. And with Azure Lighthouse, you can include alerting from different Azure tenants or for different customers you manage.
I’m keeping it simple with a flash or solid and a color choice for each alert. You might decide to use a flash pattern for warnings and a solid color change for your critical alerts, and maybe blues for your test & development resources and reds for your production resources.
Now let’s build the different steps!
Virtual Machine CPU over 50% – Flash the light purple
Create a Logic App with a LIFX Action
In Azure Logic Apps, created a new Logic App (consumption). Give it a name such as LIFX-FlashPurple and select a resource group and region. Click Create to make this new Azure resource. Once the deployment is complete, click the Go to resource button. This will take you into the Logic Apps Designer. Choose the Azure Monitor Metrics Alert Handler, then choose this template.
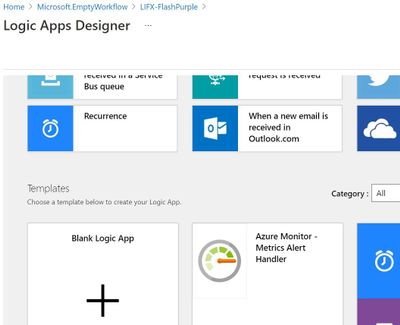 Logic Apps Designer has a built-in template for Azure Monitor Metrics alerts
The template adds the sample data for a metrics alert generated by Azure Monitor. On the “Remember to include a Content-Type header” message, click Got it, as the metric alerts already include this.
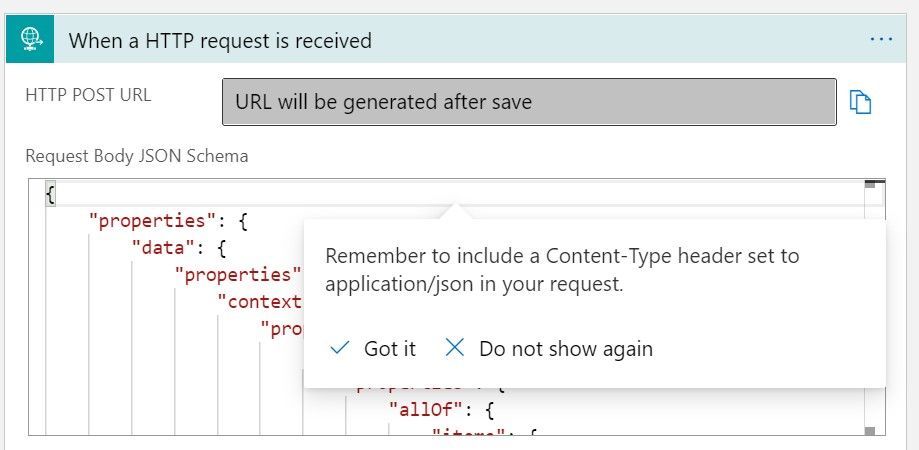 JSON sample for the Azure Monitor Metrics Alert
So now we have the trigger defined so Logic Apps knows what the data will look like that it is being sent when it needs to fire (run).
Click New Step to add our action. In the search box type LIFX
Choose “Pulse effect by quickly flashing between the given colors (Preview)”
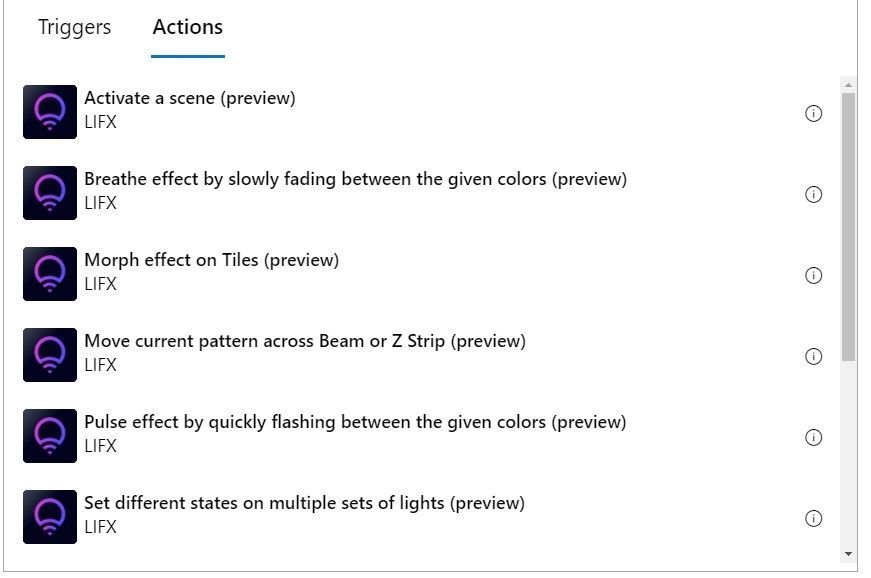 Some of the LIFX actions
Sign in to your LIFX account and authorise the LIFX Custom Connector for Power Automate by LIFX to have access to your LIFX account.
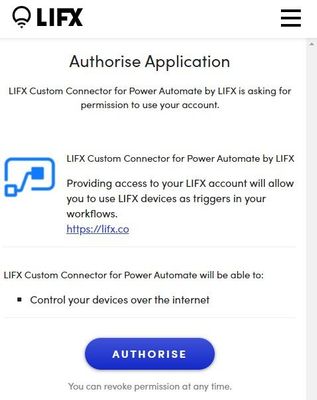 The LIFX Authorise Application box
Then, choose the lights from those listed from your account.
Select the color you want to flash to, the duration (Period) that color will stay on (e.g. 5 seconds), how many times you want it to flash (Cycles) and whether you want to turn the light on if it was off.
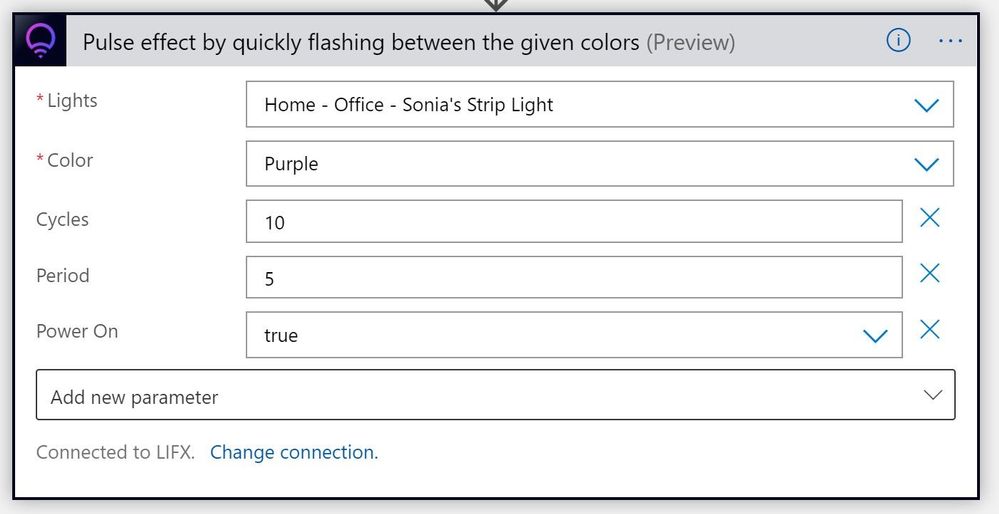
This changes my light between its original color and purple 10 times, each time leaving it on a color for 5 seconds.
Create an Action Group that includes the Logic App
In Azure Monitor, click the Actions pane and then the Manage actions button.
Click New action group. Give it a name and select a Resource Group.
You can leave the Notifications tab blank, as we won’t send any other notification that this action group has been triggered.
Click the Actions tab. Set the Action type to Logic App and select the LIFX-FlashPurple logic app you previously created. Click Review + Create, then Create.
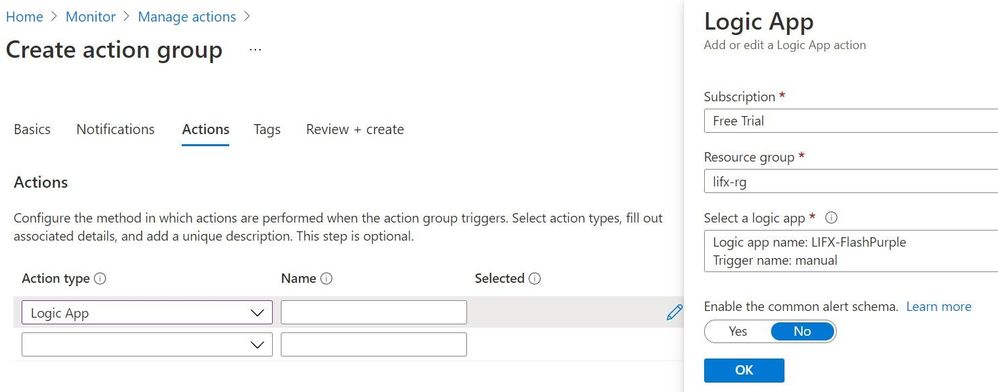
Create an Azure Monitor Metric Alert
In Azure Monitor, in the Alerts pane, click New Alert Rule.
Under Scope, click select resource and find your virtual machine.
Under Condition, click Add condition.
Add the Percentage CPU signal and set a Static threshold where the Operator is Greater than and an Aggregation type of Average has a Threshold value of 50. Evaluated based on an Aggregation granularity (Period) of 5 minutes and a 1 Minute Frequency of evaluation. Here we are asking Azure Monitor to run an evaluation every minute, and average the CPU percentage (usage) over the previous 5 minutes, then fire an alert if that number is greater than 50%. You can use whatever numbers you want – try a lower value like 10 percent to test that it works, and you should be able to trigger the alert by rebooting your virtual machine and running Windows Updates.
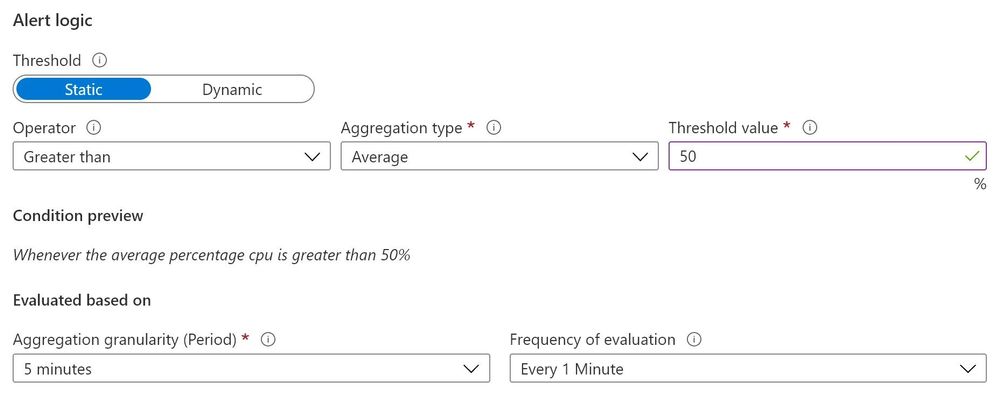
In the Actions section, click Add action group and select the LIFX-Flash action group you created in the previous step.
Give the alert rule a name e.g. CPU over 50pc, then click Create alert rule.
Now we have our Logic App to flash the light purple, added to an Action Group that the Azure Monitor metric alert will call when the specific threshold is reached!
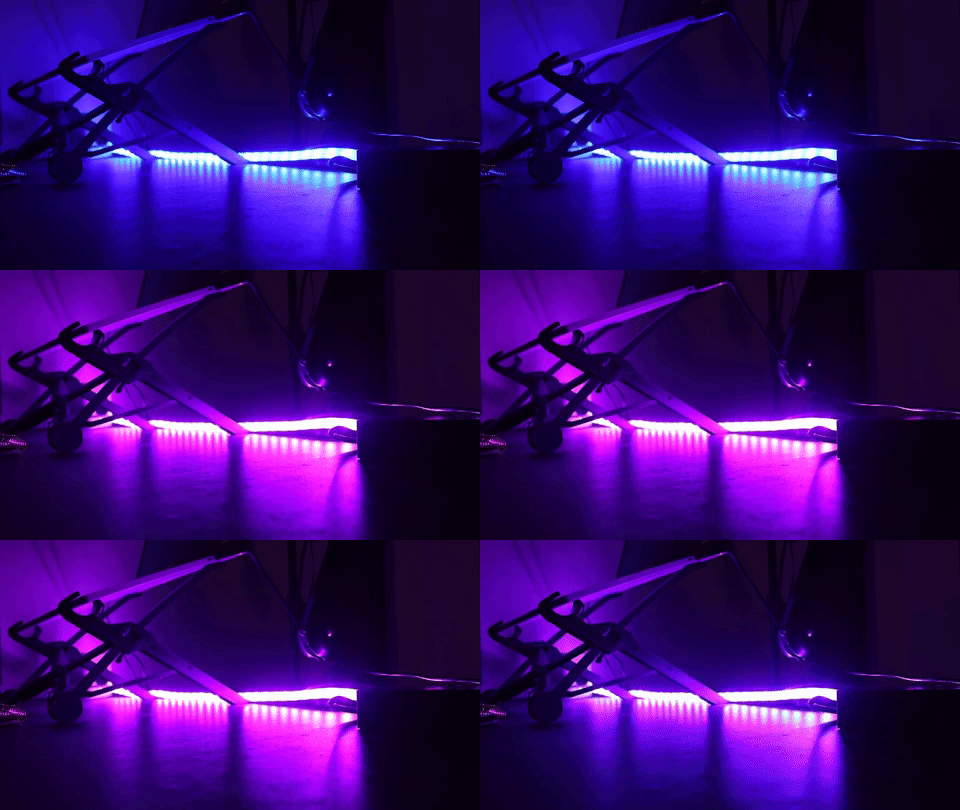 We have an Azure Monitor alert!
Service Health Alert – set the light to solid red
This previous example is great for a alerting on a specific metric on one resource. But what if there’s a problem with the Azure Virtual Machines service in general (or any other Azure service you choose)? We can use similar steps to change our light if Azure Service Health reports an issue, using Service Health Alerts and Logic Apps.
Create a Logic App for a Service Health alert to set the LIFX light to solid red
In Azure Logic Apps, created a new Logic App (consumption). Give it a name such as LIFX-SolidRed and select a resource group and region. Click Create to make this new Azure resource. Once the deployment is complete, click the Go to resource button. This will take you into the Logic Apps Designer. Choose When a HTTP request is received, then click Use sample payload to generate schema.
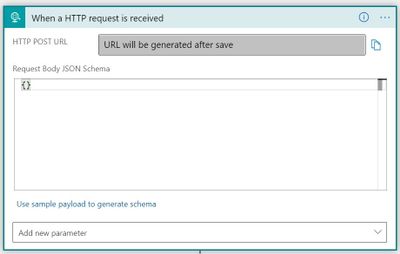
Copy and paste the JSON code from the Service Health webhook example here: https://docs.microsoft.com/azure/azure-monitor/alerts/activity-log-alerts-webhook#servicehealth
Click New Step to add our action and choose LIFX (or search for it).
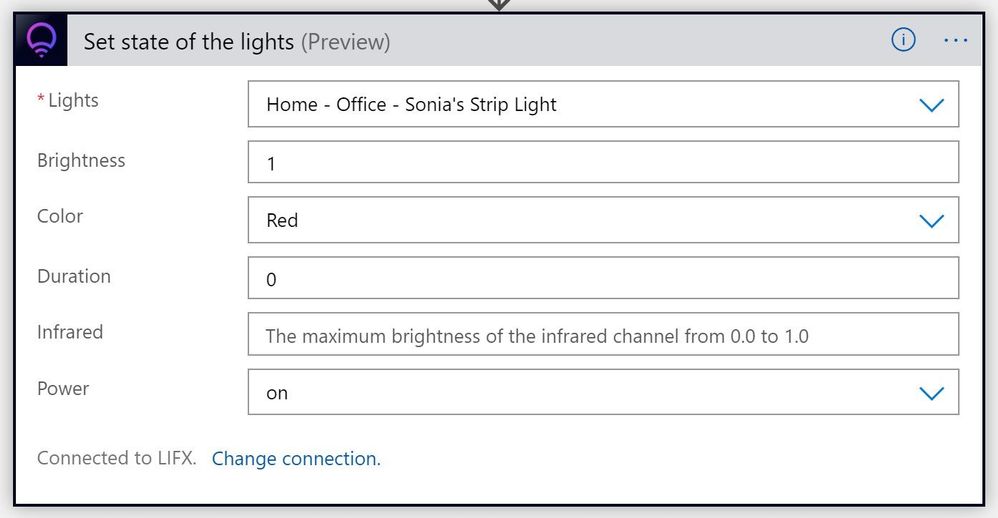
Choose Set state of the lights (Preview)
Choose the lights from those listed from your account.
Set the power to on. Select the color you want to change the light to (e.g. red), set the Brightness (up to a value of 1.0 for full brightness) and set the Duration to 0.
This will turn the light red and leave it that color. Click Save. Now we have a solid red action for our smart light.
Create a Service Health alert
In Azure Service Health, click Health alerts then Add service health alert.
Under Condition, select the Subscription and Services you want – we’ll select Virtual Machines for this example. Leave the Global Region selected and add any specific regions where you have resources.
Under Service health criteria, select the event types you wish to alert on – Service issue, planned maintenance, health advisories or security advisory (and you can select multiple event types).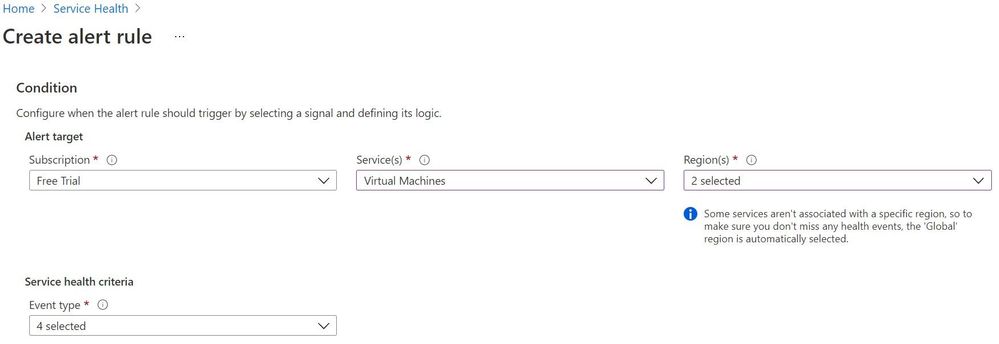
Under Actions, click Add action groups and Create action group. Select a resource group and give your action group a name (like LIFX-Red-AG). In Action type, choose Logic App and select your LIFX-SolidRed logic app you created in the previous step. Click Review + Create, then Create.
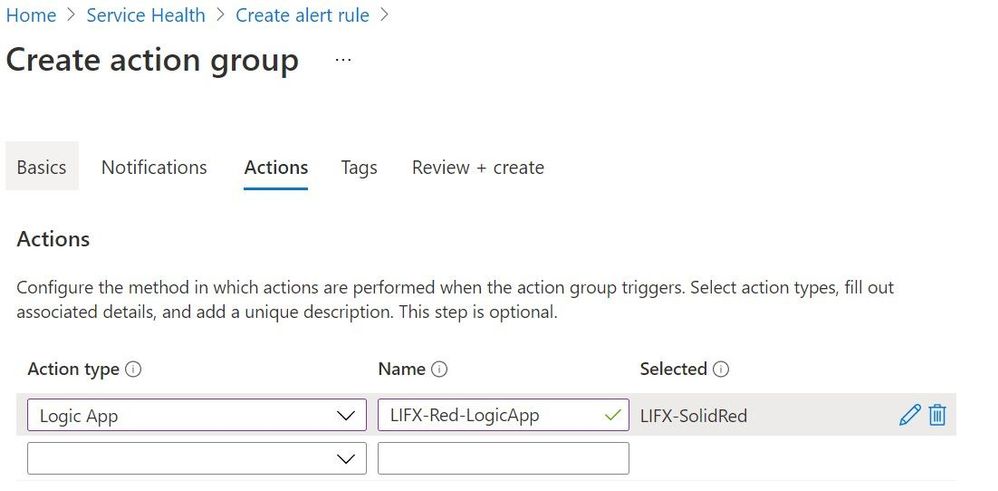
Back on the Service Health alert page, give it a name (like Service-Health-LIFXRed) and click Create alert.
If Azure Service Health issues an alert for the Virtual Machines service in my region or globally, the LIFX strip will turn red and stay red!
Summary
Now you have the building blocks of Azure Monitor, Service Health alerts, Logic Apps and the LIFX connector, what other scenarios would you “bring to light”? Remember, Azure Monitor can query non-Azure resources with Azure Arc, and there are many other trigger sources for Logic Apps (including Microsoft and non-Microsoft products).
Scott Hanselman uses the LIFX API and the Microsoft Graph to change his home office light to indicate his presence status from Microsoft Teams (busy, available etc.) For more details, visit https://www.hanselman.com/blog/mirroring-your-presence-status-from-the-microsoft-graph-in-teams-to-lifx-or-hue-bias-lighting
And, the LIFX Connectors (in Preview) are also available in Power Automate! So you can explore lighting up other triggers from other systems and parts of your business process, if you don’t use Azure Logic Apps. Maybe change your light if a message is posted into a particular Microsoft Teams channel?
Share your use cases in the comments!
Learn More with Microsoft Learn
Monitor the usage, performance and availability of resources with Azure Monitor
Build automated workflows to integrate data and apps with Azure Logic Apps
Get started with Power Automate
Brought to you by Dr. Ware, Microsoft Office 365 Silver Partner, Charleston SC.


Recent Comments