This article is contributed. See the original author and article here.
Written by Jason Yi, PM on the Azure Edge & Platform team at Microsoft.
Acknowledgements: Dan Lovinger
Imagine this, you have an Azure Stack HCI cluster set up and ready to go. But you have that lingering question: What is your cluster’s storage performance potential? In such cases, you can rely on micro-benchmarking tools such as DiskSpd. And if you are not aware, the tool helps you customize and configure your own synthetic workloads by tweaking built in parameters. For more information, you can read about it here.
“Visible” and Clean Data
Most folks who already have experience with DiskSpd are likely familiar with the txt output option, which is also displayed in the terminal. The purpose behind this output was to present the data in a human readable format. We also aggregated some of the finer details to generate practical metrics for the users. This also means that we determined which metrics would be considered valuable. But, did you know that there is an option to output in XML, which reveals additional, granular data such as the total IOs achieved per second.
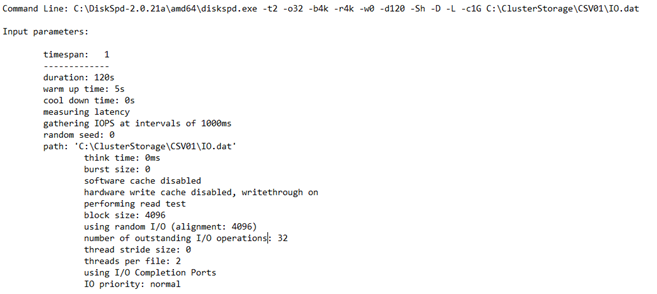
Let’s first take a few moments to review the txt output. As you may know, this output is split into four different sections:
Input settings:
CPU utilization details:

Total IO performance metrics:

Latency percentile analysis (-L parameter):

This result produces a detailed view of a couple performance metrics. That’s great, but what if you are interested in other data insights? If you did not read carefully through the DiskSpd wiki page, you may have missed the fact that there is a “hidden feature.” There is another output format that generates an XML file. This can be invoked by the -Rxml parameter and piped into an XML file with your preferred file name. But wait, there’s more! If you peep into the XML file, you will notice that there is more data than what was originally shown in the txt output, such as the total IOs achieved per second. More specifically, the XML output reveals more granular data as opposed to the aggregated data for the human eyes. If you wish to take a look, be warned – your eyes will burn from the squinting.
Table of Contents: XML
Before your eyes burn, let’s create a brief table of contents for the XML file.
<System> Under this element, you have some basic information regarding the system itself, such as the server/VM name, DiskSpd version, number of processors, etc.

<Profile> Under this element, you will find your input parameters from when you ran DiskSpd. To name a few, this includes the queue depth, thread count, warm up time, test duration, etc. There are quite a few sub-elements within this section. Luckily, most of them are self-explanatory, and so let us focus on a few of them.
- <TimeSpans> Under this element, you will find <TimeSpan> elements. Each of those <TimeSpan> elements represent one DiskSpd test run. As you may have guessed, the content within <TimeSpan> contains a set of parameters that you, the user, specifies. For example, you can see that the <requestcount> element is set to 32 since we initially set the queue depth to be 32 when we ran DiskSpd. You can think of this section as being analogous to the “input settings” result in the txt output.

<TimeSpan> This element is not to be confused with the above <TimeSpan> element. This section contains the results of your DiskSpd test. It is similar to the data presented in the txt file, but with added granular data. More specifically, you can view the CPU usage, IOPS statistics and latency statistics (average total milliseconds, standard deviation, etc.), in their respective sub-elements:
- <CpuUtilization>
- The CPU data is broken down per core.
- <Latency>
- The latency data is broken down into separate “buckets” where each bucket corresponds to 1 percentile rank, in ascending order from 0 to 100%.
- <Iops>
- The IOPS data is broken down into separate “buckets” where each bucket corresponds to the IO data for 1 millisecond.

This may give rise to the question; can you modify the contents of this XML file and pipe it back into DiskSpd? Yes, you absolutely can! In fact, there is another parameter precisely for this purpose (-X). Here are the following steps to get you started: (great for batch testing!)
- Before using this parameter (-X), you will need to preserve the contents within the <Profile> element. Any other data that exists in the XML file may be discarded. If you plan to run the DiskSpd test with modified input parameters, be sure to make the appropriate changes in the <Profile> section.
- Optional: If you plan to run multiple DiskSpd tests, you can add more <TimeSpan> elements under <Profile>, with your desired input parameters.
- You can then run DiskSpd with the -X parameter which will take the XML file path as input and output a new XML (or txt) file with the newly generated result.

Bonus: Script to Extract IOPS
In case you wanted to start somewhere, I’ve included a short script that takes in a DiskSpd XML output named “output.xml” and extracts the total IOs achieved per second into a neat CSV file for you to view (ensure they are in the same path). This might be a good place to start if you want to get more data insights about IOPS. **Foreshadowing**
Final Remarks
Hopefully, this provides a solution for those situations where you always wanted a more detailed form of data or to run DiskSpd batch tests. You can also imagine that there are a variety of ways you can manipulate the XML output through PowerShell scripts. Alas, this is for another day.
*Script Below*
# Written by Jason Yi, PM
# 12/2020
<#
.PARAMETER d
integer number of diskspd runs (can consider it as duration since each run is one second long)
.PARAMETER path
the path to the test file
.PARAMETER rw_flag
the default is 0. 0 represents that the user wants to input their custom read/write ratio whereas 1 represents that the user wants a randomized read/write ratio
.PARAMETER g_min
the minimum g parameter (g parameter is the throughput threshold)
.PARAMETER g_max
the maximum g parameter (g parameter is the throughput threshold)
.PARAMETER b
the block size in bytes
.PARAMETER r
random IO aligned to specified size in bytes
.PARAMETER o
the queue depth
.PARAMETER t
the number of threads
.PARAMETER w
the ratio of write tests to read tests
#>
Param (
[Parameter(Position=0,mandatory=$true)][int]$d,
[Parameter(Position=2,mandatory=$true)][string]$path, # C:ClusterStorageCSV01IO.dat
[int]$rw_flag = 0,
[int]$g_min = 0,
[int]$g_max = 8000,
[int]$b = 4096,
[int]$r = 4096,
[int]$o = 32,
[int]$t = 4,
[int]$w = 0)
Function Create-Timespans{
<#
.DESCRIPTION
This function takes the input number of diskspd runs (or duration) and lasts for that input number of seconds while randomizing
the throughput threshold within a specified range. Includes same parameters initially passed in by user.
#>
Param (
[int]$d,
[string]$path,
[int]$g_min,
[int]$g_max,
[int]$b,
[int]$r,
[int]$o,
[int]$t,
[int]$w,
[int]$rw_flag
)
[xml]$xml=@”
<Profile>
<Progress>0</Progress>
<ResultFormat>xml</ResultFormat>
<Verbose>false</Verbose>
<TimeSpans>
<TimeSpan>
<CompletionRoutines>false</CompletionRoutines>
<MeasureLatency>true</MeasureLatency>
<CalculateIopsStdDev>true</CalculateIopsStdDev>
<DisableAffinity>false</DisableAffinity>
<Duration>1</Duration>
<Warmup>0</Warmup>
<Cooldown>0</Cooldown>
<ThreadCount>0</ThreadCount>
<RequestCount>0</RequestCount>
<IoBucketDuration>1000</IoBucketDuration>
<RandSeed>0</RandSeed>
<Targets>
<Target>
<Path>$path</Path>
<BlockSize>$b</BlockSize>
<BaseFileOffset>0</BaseFileOffset>
<SequentialScan>false</SequentialScan>
<RandomAccess>false</RandomAccess>
<TemporaryFile>false</TemporaryFile>
<UseLargePages>false</UseLargePages>
<DisableOSCache>true</DisableOSCache>
<WriteThrough>true</WriteThrough>
<WriteBufferContent>
<Pattern>sequential</Pattern>
</WriteBufferContent>
<ParallelAsyncIO>false</ParallelAsyncIO>
<FileSize>1073741824</FileSize>
<Random>$r</Random>
<ThreadStride>0</ThreadStride>
<MaxFileSize>0</MaxFileSize>
<RequestCount>$o</RequestCount>
<WriteRatio>$w</WriteRatio>
<Throughput>0</Throughput>
<ThreadsPerFile>$t</ThreadsPerFile>
<IOPriority>3</IOPriority>
<Weight>1</Weight>
</Target>
</Targets>
</TimeSpan>
</TimeSpans>
</Profile>
“@
# 1 flag means that the user wishes to randomize the rw ratio
# 0 flag means that the user wishes to control the rw ratio
# Basically, throw an error when the flag is no 0 or 1
if ( ($rw_flag -ne 1) -and ($rw_flag -ne 0) ){
throw “Invalid rw_flag value. Please choose 0 to provide your own rw ratio, or 1 to randomize the rw ratio.
“
}
$path = Get-Location
# loop up until the number of runs (duration) and add new timespan elements
for($i = 1; $i -lt $d; $i++){
$g_param = Get-Random -Minimum $g_min -Maximum $g_max
$true_w = Get-Random -Minimum 0 -Maximum 100
# if there is only one timespan, add another
if ($xml.Profile.Timespans.ChildNodes.Count -eq 1){
# clone the current timespan element, modify it, and append it as a child
$new_t = $xml.Profile.Timespans.Timespan.Clone()
$new_t.Targets.Target.Throughput = “$g_param”
if ($rw_flag -eq 1){
$new_t.Targets.Target.WriteRatio = “$true_w”
}
$null = $xml.Profile.Timespans.AppendChild($new_t)
}
else{
# clone the current timespan element, modify it, and append it as a child
$new_t = $xml.Profile.Timespans.Timespan[1].Clone()
$new_t.Targets.Target.Throughput = “$g_param”
if ($rw_flag -eq 1){
$new_t.Targets.Target.WriteRatio = “$true_w”
}
$null = $xml.Profile.Timespans.AppendChild($new_t)
}
}
# show updated result
$xml.Profile.Timespans.Timespan
# save into xml file
$xml.Save(“$pathexpand_profile.xml”)
}
#
# SCRIPT BEGINS #
#
# create the xml file with diskspd parameters
Create-Timespans -d $d -g_min $g_min -g_max $g_max -path $path -b $b -r $r -o $o -t $t -w $w -rw_flag $rw_flag
# create path, input file, and node variables
$path = Get-Location
# feed profile xml to DISKSPD with -X parameter (Running DISKSPD)
Invoke-Expression “.diskspd.exe -X’$pathexpand_profile.xml’ > output.xml”
$file = [xml] (Get-Content “$pathoutput.xml”)
$nodelist = $file.SelectNodes(“/Results/TimeSpan/Iops/Bucket”)
$ms = $nodelist.getAttribute(“SampleMillisecond”)
# store the bucket objects into a variable
$buckets = $file.Results.TimeSpan.Iops.Bucket
# change the millisecond values to seconds
$time_arr = 1..$d
foreach ($t in $time_arr){
$buckets[$t-1].SampleMillisecond = “$t”
}
# select the objects you want in the csv file
$nodelist |
Select-Object @{n=’Time (s)’;e={[int]$_.SampleMillisecond}},
@{n=’Total IOs’;e={[int]$_.Total}} |
Export-Csv “$pathiops_stat_seconds.csv” -NoTypeInformation -Encoding UTF8 -Force # Have to force encoding to be UTF8 or data is in one column (UCS-2)
# import modified csv once more
$fileContent = Import-csv “$pathiops_stat_seconds.csv”
# if duration is less than 7 (number of percentile ranks), then add empty rows to fill that gap
if ($d -lt 7 ) {
for($i=$d; $i -lt 7; $i++) {
# add new row of values that are empty
$newRow = New-Object PsObject -Property @{ “Time (s)” = ” }
$fileContent += $newRow
}
}
# show output in the terminal
$fileContent | Format-Table -AutoSize
# export to a final csv file
$fileContent | Export-Csv “$pathiops_stat_seconds.csv” -NoTypeInformation -Encoding UTF8 -Force
Brought to you by Dr. Ware, Microsoft Office 365 Silver Partner, Charleston SC.

Recent Comments