This article is contributed. See the original author and article here.
Along with the announcement of Azure Managed Grafana, we are excited to introduce new Grafana integrations with Azure Monitor including the ability to pin Azure Monitor visualizations from Azure Portal to Grafana dashboards and new out-of-the-box Azure Monitor dashboards.
Full stack visibility from multiple sources in a single screen
Grafana allows you to query, visualize and create operational dashboards on Azure Monitor data. Using Azure Managed Grafana, you can now view your Azure monitoring data in Grafana dashboards in a few simple clicks. You can quickly pin Azure Monitor visualizations from the Azure Portal to new or existing Grafana dashboards by adding panels to your Grafana dashboard directly from Azure Monitor. Additionally, you can combine app and infrastructure metrics from multiple Azure sources into a single dashboard for full stack visibility.
How to create your first dashboard
In this example of a full-stack dashboard used to monitor Azure App Services, a DevOps engineer wants to include application layer response times from Azure Monitor application insights, garbage collection counts from Azure Monitor metrics and user events by type from Azure Monitor logs all in a single screen view.
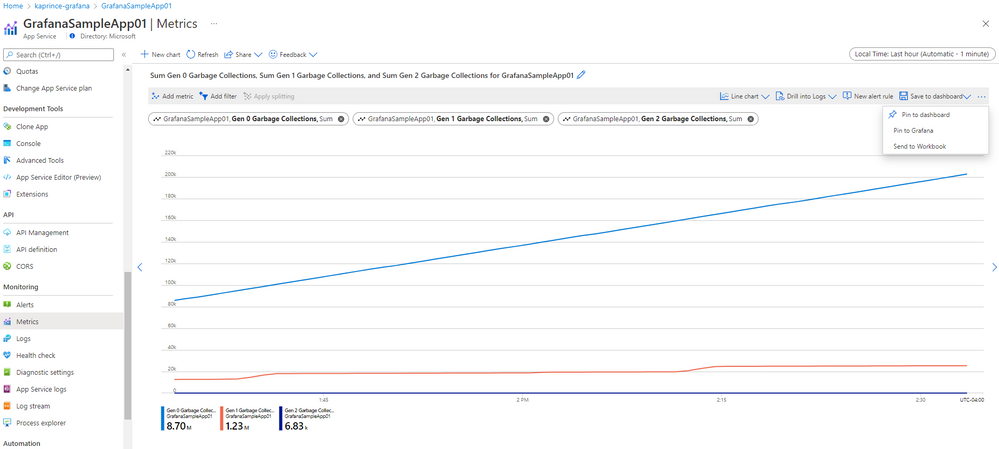
After creating an Azure Managed Grafana workspace in the Azure portal, the engineer navigates to Azure Monitor metrics explorer to build the chart for the Garbage Collections metrics from the Azure App Service platform. Then, use Pin to Grafana to embed the chart into the dashboard.
Next, the engineer navigates to Azure Monitor Application Insights and uses Metrics to create a chart showing page load time component metrics before using Pin to Grafana to embed the chart into the same Grafana dashboard.

Last, the engineer uses Log Analytics to write a custom query to view the number of user events on the App Service split by event type. This query can also be run in Grafana which supports Azure Monitor logs and Azure Resource Graph in addition to the Azure Monitor metrics shown above.

The resulting Grafana dashboard highlights that multiple data sources and different layers of the application stack can be monitored in a single dashboard.

Get started quickly with new out of the box dashboards
You can also easily get started with full-stack Azure app and infrastructure monitoring using out-of-the-box Grafana dashboards. New dashboards are now available for several popular Azure Monitor insights and to view Azure alerts. These dashboards are included in or can be downloaded from Azure Monitor Team dashboards. Use these out of the box dashboards ‘as is’ or as starting points for creating your own custom versions.
- Application insights dashboards
- Application Overview – View the usage, reliability, and responsiveness of your app in a single screen. Drill down to additional dashboards and the Azure Portal in context to continue troubleshooting.
- Application Performance – View response times for operations and dependencies
- Application Failures – View failures by response codes, exception types and dependencies.

- VM insights dashboards
- Azure VM Monitoring – VM Insights by Workspace
- Azure VM Monitoring – VM Insights by Resource Group

- Container Insights
- Azure Monitor for Containers – View cluster and namespace utilization, node infrastructure metrics based on data stored in the relevant Log Analytics workspace.

- Azure Monitor Alerts
- Alerts at scale – View alerts with their monitor conditions and state across one of more resource groups. Drill into Alert consumption dashboard for additional details.
- Alerts consumption – View the details of individual alerts. Drill into Portal with alert context to continue investigation.

Notes:
These new workflows are in addition to previously announced Azure Managed Grafana capabilities including:
- System-assigned Managed Identity
- Azure RBAC roles for Grafana administrator, editor, and viewer.
Get started today with this Quickstart on creating your first Azure Managed Grafana workspace.
Brought to you by Dr. Ware, Microsoft Office 365 Silver Partner, Charleston SC.

Recent Comments