This article is contributed. See the original author and article here.
While the Azure Security Center dashboard is extremely rich with detail information about different workloads, recommendations, and alerts, in some scenarios you may need to customize your dashboard to visualize only what is important for your daily activities.
ARG basics for Azure Security Center
Azure Resource Graph (ARG) provides an efficient way to query at scale across a given set of subscriptions for any Azure Resource. With ARG, you can query, visualize, or export Azure Security Center (ASC) recommendations in order to get the information that matters most to you.
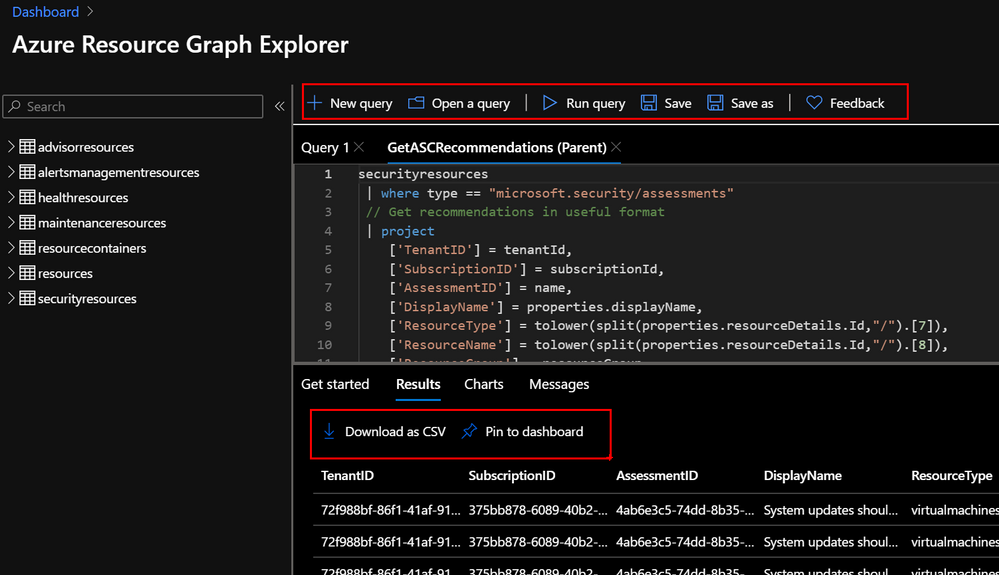
In the Azure Portal, navigate to Resource Graph Explorer and get familiar with the different options. You can create and save your favourite queries, export results into CSV and even pin them into your Azure Dashboard. Bellow you can see a very basic ARG query that will return the Azure Security Center recommendations from the selected subscriptions and arrange information in a more readable manner.

securityresources
 | where type == "microsoft.security/assessments"
 // Get recommendations in useful format
 | project
	['TenantID'] = tenantId,
	['SubscriptionID'] = subscriptionId,
	['AssessmentID'] = name,
	['DisplayName'] = properties.displayName,
	['ResourceType'] = tolower(split(properties.resourceDetails.Id,"/").[7]),
	['ResourceName'] = tolower(split(properties.resourceDetails.Id,"/").[8]),
	['ResourceGroup'] = resourceGroup,
	['ContainsNestedRecom'] = tostring(properties.additionalData.subAssessmentsLink),
	['StatusCode'] = properties.status.code,
	['StatusDescription'] = properties.status.description,
	['PolicyDefID'] = properties.metadata.policyDefinitionId,
	['Description'] = properties.metadata.description,
	['RecomType'] = properties.metadata.assessmentType,
	['Remediation'] = properties.metadata.remediationDescription,
	['RemediationEffort'] = properties.metadata.implementationEffort,
	['Severity'] = properties.metadata.severity,
	['Categories'] = properties.metadata.categories,
	['UserImpact'] = properties.metadata.userImpact,
	['Threats'] = properties.metadata.threats,
	['Link'] = properties.links.azurePortal
A Starter kit has been published in the Azure Security Center Github Community page to help you get familiar with recommendations as well as the data structure from Azure Security Center. Just copy/paste the ARG queries and start to customize them to your needs.

Creating your custom Dashboard
One of the coolest features of ARG, is that, apart from querying and exporting your results, you can easily create charts and dashboards directly from the Azure Resource Graph Explorer console and even pin them directly into your Azure Portal.
Let’s use one of the samples from the GIthub repo to query for High Severity and Low Remediation Effort recommendations.

By simply adding a few lines to the initial examples shared above, we were able to build different views summarizing:
Threat vectors identified
// Filter
 | where Severity == "High"
 | where RemediationEffort == "Low"
// summarize and order
 | summarize count() by tostring(Threats)
 | order by count_
Type of impacted resources
// Filter
 | where Severity == "High"
 | where RemediationEffort == "Low"
// summarize and order
 | summarize count() by tostring(Categories)
 | order by count_
List of recommendations
// Filter
 | where Severity == "High"
 | where RemediationEffort == "Low"
List of impacted resources
// Filter
 | where Severity == "High"
 | where RemediationEffort == "Low"
// summarize and order
 | summarize count() by ResourceName, ResourceType
 | order by count_
Impacted subscriptions by threat vector
// Filter
 | where Severity == "High"
 | where RemediationEffort == "Low"
// summarize and order
 | summarize count() by SubscriptionID
 | order by count_
Impacted resource group by threat vector
// Filter
 | where Severity == "High"
 | where RemediationEffort == "Low"
// summarize and order
 | summarize count() by ResourceGroup
 | order by count_
Additional Resources
Reviewers
Special thanks to:
Yuri Diogenes, @Yuri Diogenes, Senior Program Manager (CxE ASC Team)
Tal Rosler, @tal_rosler, Program Manager (ASC Engineering Team)
Brought to you by Dr. Ware, Microsoft Office 365 Silver Partner, Charleston SC.

Recent Comments