This article is contributed. See the original author and article here.
Introduction
In this document we will describe a method of setting up periodic niping monitoring within an SAP infrastructure driven by the Telegraf monitoring agent, and reported via the Azure Monitor facility.
Disclaimer
We do not guarantee that documented configurations are correct or the best way to implement a function – the intention of creating this document is to describe a configuration that AGCE team has created and customers have found useful.
Overview
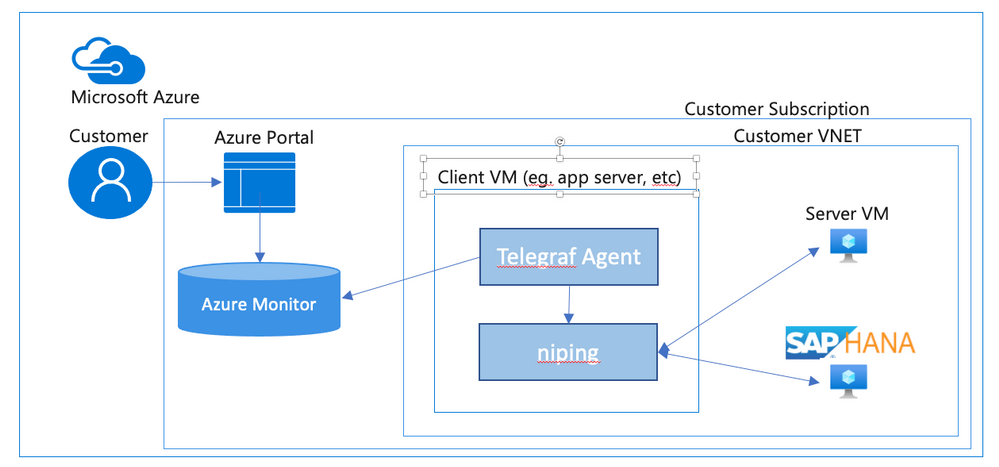
In an SAP environment it is useful to monitor various aspects of the VMs in the landscape, and to collect and alert on that monitored data. This is an example of setting up SAP niping to periodically report the inter-VM latency, specifically between the application servers and the ASCS, as well as between the application servers and the database. Here is a diagram of the configuration that we describe in this document:

SAP provides the niping application that is useful for network testing – there is a blog post describing the use of niping here. It can test latency, throughput and stability – in this document we will focus on its latency testing capability. niping is typically used for initial validation of an environment (i.e. not under any significant loading) and is not generally used continuously. However, this does provide a great example for this document, and a similar architecture can be used to monitor many other OS and SAP metrics. Please keep in mind that the measured latency between servers will vary based on the network load on the servers at the time.
In this solution we will use the InfluxData Telegraf agent described in Azure documentation. This agent runs on the monitored VMs and sends the collected data to Azure Monitor. If you don’t want to use telegraf you can collect the test data from niping and send the result to Azure monitor yourself. This would likely be done in a shell script scheduled with cron – however, this configuration won’t be described in this document.
Requirements for this configuration
This solution has the following technical requirements:
niping application from SAP for network latency testing.
telegraf monitoring agent for invoking niping and sending the data to the Azure Monitor database.
system assigned identity for the virtual machine
virtual machine must be able to make requests to the Azure API, which is “Internet facing”. This will typically require firewall access to any applicable firewalls or network appliances.
Installation & Configuration of NIPING on NIPING servers
The NIPING application is provided by SAP, as described in SAP Note 500235 Network Diagnosis with NIPING and is delivered in SAP kernel releases, as well as via SAPROUTER.
Download the latest version of the SAPROUTER SAR file, and place it onto all VMs to be tested. Use the sapcar program to unpack the SAR file, and place the niping program in a logical place. In this example, we will put all executable files in /usr/local/bin.
# ./sapcar -xf ./saprouter_710-80003478.sar

# cp niping /usr/local/bin
On all VMs that will be niping servers (i.e. the HANA database, and the ASCS), we need to create a system service that will run the niping service. Create the file /usr/lib/systemd/system/niping-server.service, with the following contents:
[Unit]                                                                                                                                                                     │

Description=SAP niping server                                                                                                                                              │

After=network.target                                                                                                                                                       │

                                                                                                                                                                           │

[Service]                                                                                                                                                                  │

Type=simple                                                                                                                                                                │

Restart=always                                                                                                                                                             │

ExecStart=/usr/local/bin/niping -s -I 0                                                                                                                                    │

ExecReload=/bin/kill -HUP $MAINPID                                                                                                                                         │

                                                                                                                                                                           │

[Install]                                                                                                                                                                  │

WantedBy=multi-user.target
Do the following commands to make the niping service start on reboot, and to start it immediately:
#systemctl enable niping-server

#systemctl start niping-server
You can now verify that the niping program is running by doing the following:
#ps -eaf | grep niping

root      49966      1  0 14:54 ?        00:00:00 /usr/local/bin/niping -s -I 0

root      49970  47606  0 14:54 pts/0    00:00:00 grep –color=auto niping
Installation of NIPING on other servers
On the other servers in the environment, simply install the NIPING program. Use the sapcar program to unpack the SAR file, and place the niping program in a logical place. In this example, we will put all executable files in /usr/local/bin.
# ./sapcar -xf ./saprouter_710-80003478.sar

# cp niping /usr/local/bin
To test the niping connectivity to one of the servers (eg. hana1), you can do the following:
# /usr/local/bin/niping -c -H hana1
Thu Oct  1 15:19:57 2020

connect to server o.k.

send and receive 10 messages (len 1000)
——- times —–

avg     0.883 ms

max     1.108 ms

min     0.725 ms

tr   2210.668 kB/s

excluding max and min:

av2     0.875 ms

tr2  2231.505 kB/s
Note for clustered instances
In Azure, we use an Azure basic or standard load balancer to provide a “floating IP” for backend instances in a cluster. When testing the niping latency, you may want to test the latency to either individual instances behind the load balancer (i.e. use the actual hostname or IP address), or use the floating ip address, which is the frontend address in the load balancer. If you want to do the latter, make sure that the load balancer has the HA Ports configuration enabled (for the Standard Load Balancer), or you have a load balancer rule for the port that niping uses (default 3298).
Creation of niping shell script
On the monitored instances, we will use a shell script to execute niping and process the output into a Comma Separated Value (CSV) format. Create a file /usr/local/bin/niping_csv.sh with the following text:
#!/bin/bash

# set -x

/usr/local/bin/niping -c -H $1 -B 10 -L 60  -D 15 | tail -n 8  | head -n 7 | grep -v excluding | awk ‘

{

    for (i=1; i<=NF; i++)  {

        a[NR,i] = $i

    }

}

NF>p { p = NF }

END {

    for(j=1; j<=p; j++) {

        str=a[1,j]

        for(i=2; i<=NR; i++){

            str=str”,”a[i,j];

        }

        print str

    }

}’ | head -n2
Then, make the shell script executable by performing chmod a+x /usr/local/bin/niping_csv.sh. You can test this by doing:
# /usr/local/bin/niping_csv.sh hana1

avg,max,min,tr,av2,tr2

1.217,5.405,0.833,16.053,1.151,16.967
This script runs niping with these parameters -c -H $1 -B 10 -L 60 -D 15, which are (in order)
-c run this as the client side of NIPING
-H $1 do niping tests against the host specified as the first parameter, we will pass this from the telegraf monitoring script
-B 10 use a 10 byte buffer size. This is appropriate for latency testing
-L 60 run 60 iterations of the test
-D 15 delay 15 milliseconds between iterations
Of course you can modify these parameters as you see fit for your testing scenario. The rest of the shell script takes the output from niping and formats it as a CSV (comma separated value) file for easy injestion into telegraf.
Installation of Telegraf monitoring agent
Before installation of telegraf, the monitored VMs must have credentials to upload data into Azure monitor. There are several ways to provide this identity (as described in the Telegraf source github repo), but the simplest way is to use the “system-assigned identity” in the VM, which we will configure next. Go to the Azure portal, view the VM, and navigate to the Identity tab, and ensure that your VM has a system-assigned identity set to On.

To install telegraf, refer to the Influxdata documentation. First install support for the go programming language. In SLES 12 SP3, you need to add the proper repo for go:
zypper addrepo https://download.opensuse.org/repositories/devel:languages:go/SLE_12_SP3/devel:languages:go.repo

zypper refresh

zypper install telegraf
Telegraf is configured via the file /etc/telegraf/telegraf.conf, which is installed with some default configurations. We are going to have a custom configuration though, that will invoke our shell script via the Telegraf “exec” input plugin. We’ll create this configuration with the following step:
telegraf –input-filter exec –output-filter azure_monitor config > azm-telegraf.confThen open the azm-telegraf.conf with your editor, and find the section starting with
###

#                            INPUT PLUGINS                                    #

###
Replace the text, starting with [[inputs.exec]] to the end of the file with the following:
[[inputs.exec]]

  commands = [

    “/usr/local/bin/niping_csv.sh hana1”

  ]
  timeout = “5s”

  name_suffix = “_niping_hana”

  data_format = “csv”

  csv_header_row_count = 1
Of course, replace “hana1” with the name or IP address of the server you are testing the latency to. You can find more information on the exec input handler in the telegraf documentation.
You can test this by running the following:
# telegraf –config ./azm-telegraf.conf –test

2020-10-02T00:47:26Z I! Starting Telegraf

> exec_niping_hana,host=pas av2=0.958,avg=0.961,max=1.315,min=0.776,tr=20.328,tr2=20.39 1601599648000000000
Copy and activate the telegraf.conf file to the configuration directory:
# sudo cp azm-telegraf.conf /etc/telegraf/telegraf.conf

# systemctl restart telegraf
At this point, telegraph should be regularly executing the niping program, converting its output to CSV, and uploading the resulting data to Azure Monitor. Check the /var/log/messages file to see if there are any errors, using grep telegraf /var/log/messages.
Configuration of the telegraf agent is via the /etc/telegraf/telegraf.conf file. Looking at that file, you should see something like this near the beginning:
[agent]

  ## Default data collection interval for all inputs

  interval = “10s”
This sets the telegraf agent to run every 10 seconds, and it will run the above shell script and niping every 10 seconds as well. You can adjust this interval within practical limits. More configuration options are documented in the telegraf github repo.
Plot your niping data in the Azure portal
Open the Azure Portal, and navigate to the Monitor tab, then select Metrics, and select the VM you installed telegraf on in the resource selector.

Select the Telegraf/execnipinghana namespace, and select the av2 metric.

Additional monitoring configuration
You can have multiple [[inputs.exec]] sections in the telegraf.conf file if you want to test niping against multiple servers (i.e. the database and the ASCS). You can also configure the niping to test latency through the floating IP/load balancer front end IP address for clustered instances if you would like to, as described in the note for clustered instances above.
There are also over 150 input plugins available in the Telegraf agent that you can find in the InfluxData list of supported plugins, and creative use of the exec plugin (as we’ve used above) can monitor virtually anything on the VM.
You can create alerts on the data you are collecting. For example, you could create an alert that fires whenever the average of the av2 metric goes over a certain value, using a rolling 5 minute average evaluated once per minute.
Brought to you by Dr. Ware, Microsoft Office 365 Silver Partner, Charleston SC.

Recent Comments