This article is contributed. See the original author and article here.
With the ever-growing cloud resources in your environment, I can’t emphasize enough how important it is to prioritize security hygiene and more importantly to constantly monitor the status of the security posture. Azure Security Center continuously assesses your resources, subscriptions for security issues. It mimics the work of a security analyst, reviews security recommendations across all workloads, applies advanced algorithms to determine how critical each recommendation is, and calculates Secure Score based on the active recommendations. Overall secure score is an accumulation of all your recommendation scores and you can view your overall secure score across your subscriptions. The score will vary based on subscription selected, the amount of resources that you have in that subscriptions and the active recommendations on those resources. Read this article to understand more about Azure Security Center Secure Score.
We’ve heard your feedback on being notified when the Secure Score downgrades by X%. We recently uploaded an automation artifact to the Azure Security Center Github repository, a playbook that helps you to monitor the secure score of the subscriptions easily and to send an alert via email once the Secure Score decreases for a configurable percentage value. This blog post explains how this automation works.
How does the automation work?
This playbook uses Secure Score API to pull the Secure Score. At every execution, it pulls the list of subscriptions for the user and for each subscription, it gets the percentage of ‘ascScore’ which is then stored in the Log Analytics workspace with the subscription ID as maximum points and current points. At every occurrence (can be defined during the deployment of the ARM template), it pulls the last scanned points and derives the score in percentage (%) and compares it with the current score. If the Logic app identifies the current score minus last scanned score percentage is greater than or equal to configured score reduction threshold (defined during deployment), it fires an alert over email.
Pre-requisites:
This playbook uses Managed identity. You need to assign reader permissions to the subscriptions you want to export for the Managed identity.
To assign Managed Identity to specific scope:
- Make sure you have owner permissions for this scope.
- Go to the subscription/management group page.
- Press ‘Access Control (IAM)’ on the navigation bar.
- Press ‘+Add’ and ‘Add role assignment’.
- Choose Reader role.
- Assign access to Logic App.
- Choose the subscription where the logic app was deployed.
- Choose ‘Send-SecureScoreReductionAlert’ Logic App. (The name might differ based on what you’ve saved the logicapp as)
- Press ‘save’.
NOTE: You can assign permissions only as an owner and make sure all selected subscriptions registered to Azure Security Center.
To assign reader permissions to subscriptions:
You have three options:
- You can assign reader permissions at the management group level for the managed identity. (preferred)
- You can assign reader permissions for the Managed Identity for each one of the subscriptions you want to get data on.
- You can use the provided PowerShell script Grant-SubscriptionPermissions.ps1 to add the identity to all subscriptions.
Deployment process and details
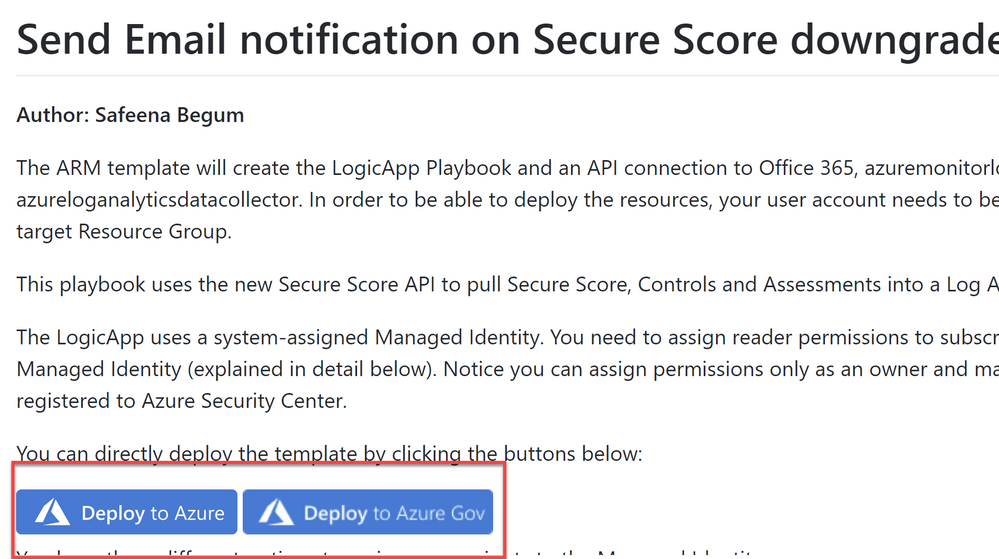
Navigate to Azure Security Center GitHub repository and select “Deploy to Azure” or “Deploy to Azure Gov” (as shown in ‘Image 1’) under Secure Score Reduction Alerts automation

Image 1: Git Hub repository
Once you have clicked on ‘Deploy’ option in the screen above, you should automatically be redirected to the Azure portal Custom deployment page where you can fill in the details of requirement as shown in ‘Image 2’

Image 2: Azure portal, Custom Deployment
Note that all the above fields are customizable per your needs. In my example above, I have filled in the details for your reference.
The ARM template will create the Logic App playbook and as you notice in ‘Image 2’ we are using three API connections O365 for sending notification alerts, Azure log monitor to query and list action for Log Analytics and Azure Log Analytics API to store the data.
During the deployment of the Logic App, you can define the Scanfrequency hour (Occurrence in hours) depending on how often you would want the logic app to scan your subscriptions. You could also define Score Reduction Threshold, where you can specify at what percentage (%) reduction, would you want the logic app to notify you on the reduction.
Once you review and create from ‘Image 2’, you would notice below resources created from the ARM template (Refer Image 3)

Image 3: Summary of the resources created from the ARM template
After the successful deployment, make sure you authorize connections to the Office365API and AzuremonitorlogsAPI. You can do that by simply clicking on Office365API connection and selecting ‘Edit API Connection’ and click on ‘Authorize’ as shown in ‘Image 4’.

Image 4: Authorize O365 API Connection
Similarly authorize the ‘azuremonitorlogs API’ connection too. Refer example ‘Image 5’

Image 5: Authorize AzureMonitorLogs API Connection
NOTE: If you’re specifying an existing workspace, You might have to manually change the connections within the Logicapp (Since the connections cannot be used across the subscriptions (by design), the connection needs to be authorized in the subscription for the first time to the Log Analytics Workspace).
You can easily authorize connection by navigating to the Logic app that’s deployed and selecting ‘Logic app designer’ , when you select the first ‘For each’ loop, under ‘Run query and list results’ variable as shown in ‘Image 6’
That should pop-up a login window asking you to sign-in. After a successful sign-in, you would notice the successful connection as shown in ‘Image 6’

Image 6: Successful connection to Workspace
The logicapp will create another custom log (dailyAscScore_CL) within that workspace. So, for the first 5-10 minutes (soon after the deployment), until the database values are created in the custom table, you might experience failed runs. Once there’s data to display, the runs will always succeed.
Output:
In an event when the Azure Security Center score reduces by the configured percentage and depending on the Scanfrequencyhour you’ve set in ‘Image 1’, it would drop you an alert notification to the email you specified in ‘Image 1’ as shown in ‘Image 7’

Image 7: Email notification alert
This logic app as well as many other can be found here:
Azure Security Center GitHub Repo
I hope you enjoyed reading this article, go ahead and deploy this playbook in your environment and prioritize monitoring security hygiene.
Reviewer
Special thanks to:
Yuri Diogenes, @Yuri Diogenes, Senior Program Manager (CxE ASC Team)
Brought to you by Dr. Ware, Microsoft Office 365 Silver Partner, Charleston SC.

Recent Comments