This article is contributed. See the original author and article here.
In our previous post about the Azure Logic Apps (Preview) extension for Visual Studio Code, we provided an deep dive into how the redesigned Logic Apps runtime is hosted as an extension on the Azure Functions runtime. We also covered how the runtime interprets a workflow definition as jobs that are durably run by the Logic Apps orchestration engine.
In this post, we explore the telemetry that the runtime emits during workflow execution along with other emitted events. You can use this telemetry to get better visibility into how well your workflows run and how the runtime works in various ways. This post also describes how you can monitor your workflows by using Application Insights and learn about the available trace types that you can use for logging.
Integration with Application Insights
The redesigned runtime includes built-in integration with Application Insights, providing you near real-time telemetry (live metrics). This capability can help you investigate failures and performance problems more easily when you use this data to diagnose issues, set up alerts, and build charts.
To open Application Insights for a logic app that you created using the preview extension and deployed to Azure, follow these steps:
- In the Azure portal, find your deployed logic app.
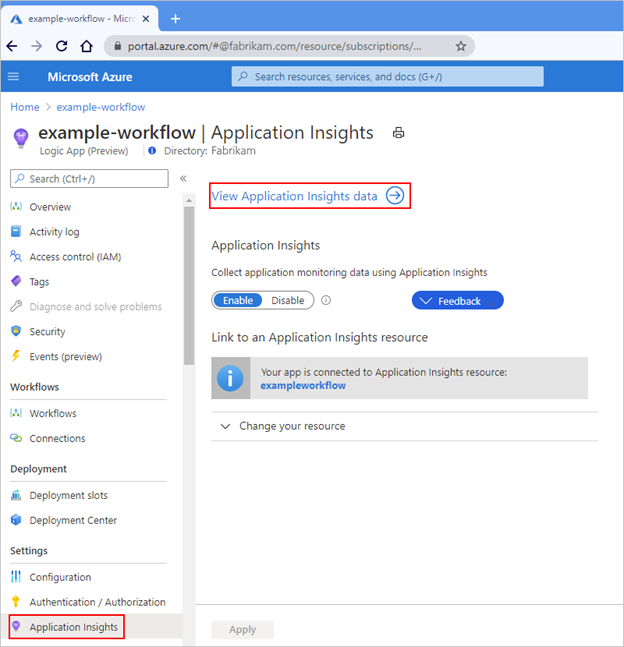
- On the logic app menu, under Settings, select Application Insights.
- If your subscription already has Application Insights enabled, on the Application Insights pane, select View Application Insights data.
If your subscription doesn’t have Application Insights enabled, on the Application Insights pane, select Turn on Application Insights. After the pane updates, at the bottom, select Apply.
For example, when Application Insights is already enabled, the pane looks like this:

When Application Insights isn’t enabled yet, the pane looks like this:

Application Insights opens and shows various metrics for your logic app, for example:

Available trace types
Each time that a workflow-related event happens, for example, when a workflow is triggered or when an action runs, the runtime emits various traces. These traces cover the lifetime of the workflow run and include, but aren’t limited to, the following types:
- Service activity, such as start, stop, and errors.
- Jobs and dispatcher activity.
- Workflow activity, such as trigger, action, and run.
- Storage request activity, such as success or failure.
- HTTP request activity, such as inbound, outbound, success, and failure.
- Ad-hoc development traces, such as debug messages.
Each event type is assigned a severity level. This table shows the severity level that’s assigned to each trace type:
Severity level | Trace type |
Critical | Logs that describe an unrecoverable failure in your logic app. |
Debug | Logs that you can use for investigation during development, for example, inbound and outbound HTTP calls. |
Error | Logs that indicate a failure in workflow execution, but not a general failure in your logic app. |
Information | Logs that track the general activity in your logic app or workflow, for example:
|
Trace | Logs that contain the most detailed messages, for example, storage requests or dispatcher activity. |
Warning | Logs that highlight an abnormal state in your logic app but doesn’t prevent its running. |
You can adjust the severity level for the data that’s captured by your logic app and transmitted to Application Insights, based on the trace type that you want.
- In the Visual Studio Code project for your logic app, find the host.json file that exists at the project root location.
- Edit the host.json file by selecting the LogLevel enum value based on the trace type that you want.
The host.json file is included with the artifact that deploys to Azure Functions, along with other files such as the workflow.json file and connections.json file.
Sample host.json file
This example host.json file sets logging to the “Trace” severity level, which captures the most detailed messages, such as storage requests, plus all the messages that are related to workflow execution activity:
{
    "version": "2.0",
    "logging": {
        "logLevel": {
            "Host.Triggers.Workflows": "Trace"
        }
    }
}
The “logging” node controls the log type filtering for all the workflows in your logic app and follows the ASP.NET Core layout for log type filtering. To specify the log type for your logic app, in the “logLevel” object, set the “Host.Triggers.Workflows” property to log type that you want. For more information about logging in .NET Core, see Log filtering.
The next post in this series explores the ways that you can query the telemetry data for your logic app’s workflows. This post also covers the ways that you can track workflow behavior and the performance for your hosting environment.
Brought to you by Dr. Ware, Microsoft Office 365 Silver Partner, Charleston SC.

Recent Comments